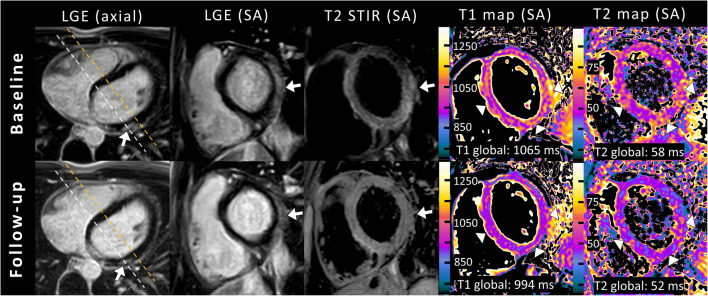
Fig. 4.
A clinical example of cardiac magnetic resonance imaging (MRI) in a 15-year-old boy with the typical appearance of acute myocarditis on cardiac MRI at baseline and with recovery on follow-up after 2 months. Cardiac MRI in end-diastole shows subepicardial enhancement of the basal lateral wall on late gadolinium enhancement (LGE) images in axial and short-axis (SA) orientation with associated focal myocardial edema (arrows) on fat-suppressed (T2-weighted short TI inversion recovery [T2 STIR]) images (white dashed lines in axial LGE images represent the imaging plane of LGE and T2 STIR). T2 STIR images at follow-up show normalization of focal myocardial edema. Mapping parameters displayed high myocardial native T1 and T2 relaxation times at baseline cardiac MRI and normalization at follow-up. Notably, in this example, T1 and T2 maps cover the transition between the basal and mid segments outside the visible late gadolinium enhancement lesions (orange dashed lines in axial LGE images represent the imaging plane of the quantitative maps) and detected additionally diffuse myocardial alterations in the septal and inferior wall, which normalized at follow-up (arrowheads)

