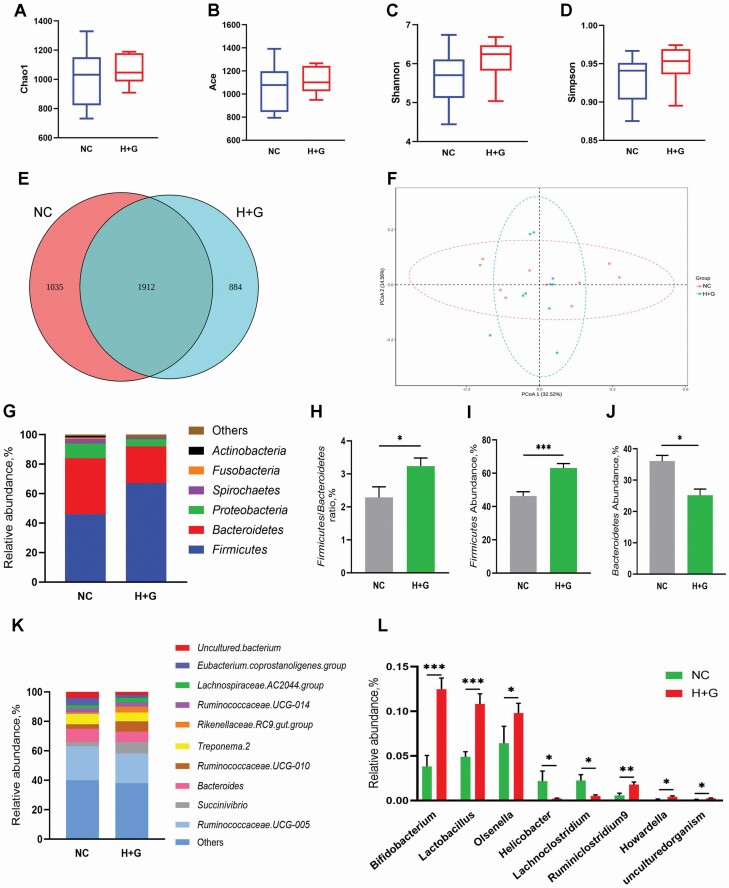
Figure 2.
Effects of sodium humate and glutamine combined supplementation on intestinal microbiota of weaned calves. The Chao 1, Ace, Shannon, and Simpson indexes of α-diversity analysis in the OTU level among two groups (A–D). Venn diagram of the operational taxonomic unit (OTU) distribution shows unique and shared OTUs between the two groups (E). β-Diversity principal coordinate analysis (PCoA) was performed to calculate the different intestinal microbiota structures among the two groups (F). Bar graphs represent relative abundance of gut bacteria at the phylum level (G). The ratio of Firmicutes to Bacteroidetes (H). The relative abundance of Firmicutes (I) and Bacteroidetes (J). Bar graphs represent relative abundance of gut bacteria at the genus level (K). The relative abundance of gut bacteria with significant differences in the genus level (L). Data were shown as means ± SEM (n = 10). NC, negative control (basal diet); H+G, basal diet+5% HNa and 1% Gln. *P < 0.05, **P < 0.01, ***P < 0.001 vs. the NC group.

