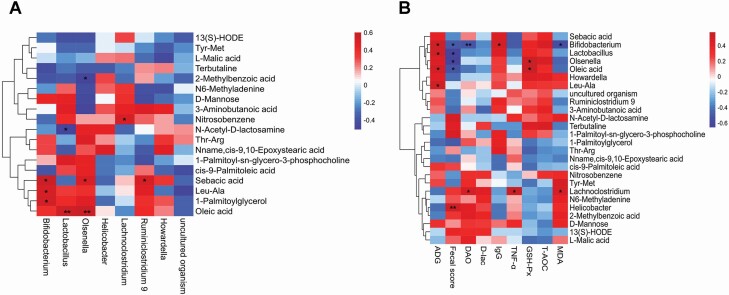
Figure 5.
Heatmap of Sperman’s correlation analysis between significantly different intestinal microbiota at the genus level and differential metabolites (A), ADG, fecal score, and serum parameters (B). The significant correlations (r > 0.50 or r < −0.50, P < 0.05) were shown in the correlation heatmaps. The intensity of the colors represented the degree of correlation (red, positive correlation; blue, negative correlation). Significant correlations were marked by *P < 0.05, **P < 0.01.

