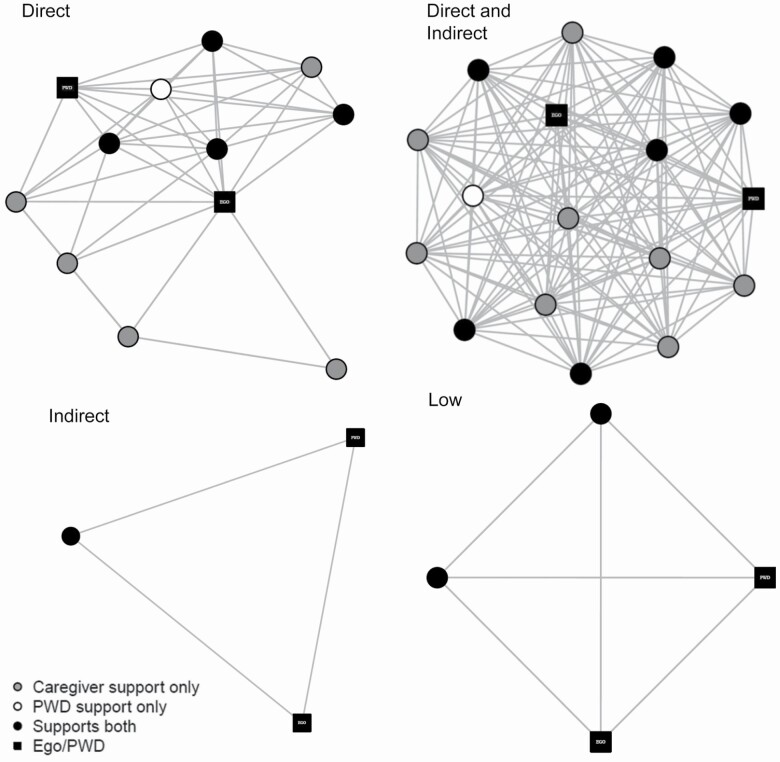
Figure 1.
Examples of caregiver personal networks for each of the four network types. Notes: Network members are represented by circles (graph “nodes”), the caregiver and persons with dementia (PWDs) are represented by black squares, and lines between nodes represent network members who know each other. The layout of the nodes, generated with the Fruchterman–Reingold force-directed placement algorithm, highlights structural characteristics of the network, such as density, the amount of lines between nodes, and size (the number of nodes). Composition among network members is highlighted by node color: gray circular nodes are those who were identified as having only provided support to the caregiver and not having provided support to the PWD; white circular nodes were those identified as having provided support to the PWD only and not support to the caregiver; black circular nodes were those who provided support to both caregiver and PWD.

