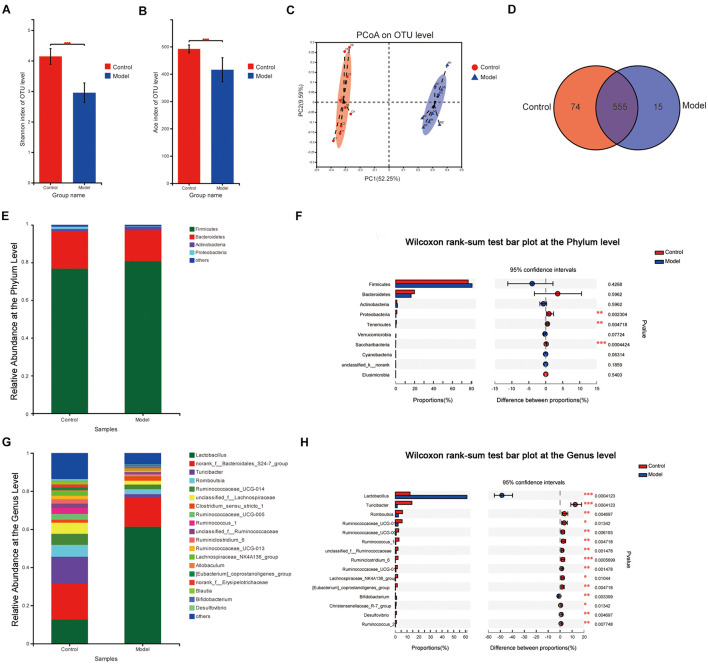
FIGURE 3.
Microbiota change after multifactor stimulation. (A) The Shannon index. (B) The Ace index. (C) Principal coordinate analysis (PCoA) analysis of β-diversity. (D) Venn analysis of gut microbiota. (E,G) The relative abundance at the phylum and genus levels. (F,H) Statistical results of the Wilcoxon rank-sum test in the phylum and genus levels (*p < 0.05, **p < 0.01, ***p < 0.001). n = 9.

