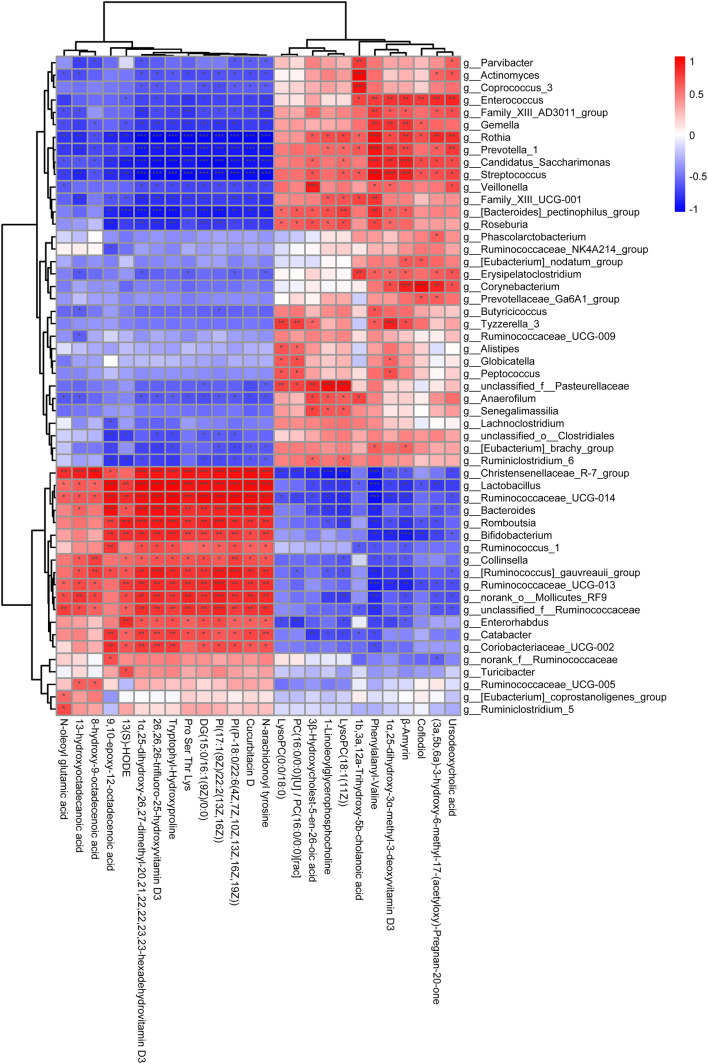
FIGURE 6.
The correlation analysis of the differential metabolites and intestinal microbes in the genus level. The ordinate represents the differential metabolites and the abscissa represents the intestinal microbes in the genus level. The color represents the correlation coefficient (***p < 0.001, **p < 0.01, *p < 0.05).

