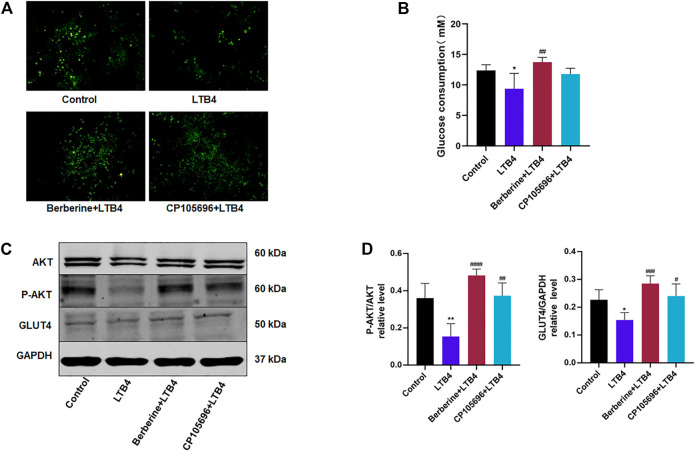
FIGURE 1.
BBR improved insulin resistance of HepG2 cells induced by LTB4. (A) Glucose uptake of 2-NBDG assays from HepG2 cells detected by fluorescence microscopy. Scale bar, 200 μm (n = 3). (B) Glucose consumption was determined using the glucose oxidase method. The amount of glucose consumption was calculated by subtracting the glucose concentrations of the blank wells from the remaining glucose in the cell-plated wells (n = 5). (C) Western blots showed the protein levels of the insulin signaling pathway (P-AKT, GLUT4). (D) Densitometric analysis of p-AKT and GLUT4 in total protein was calculated (n = 4). Error bars represent mean ± SD. BBR, Berberine, 10 μM; CP105696, 10 μM; LTB4, Leukotriene B4, 100 nM * p < 0.05 vs. Control; # p < 0.05 vs. LTB4. ** p < 0.01; ## p < 0.01; ### p < 0.001; #### p < 0.0001.

