Fig. 3.
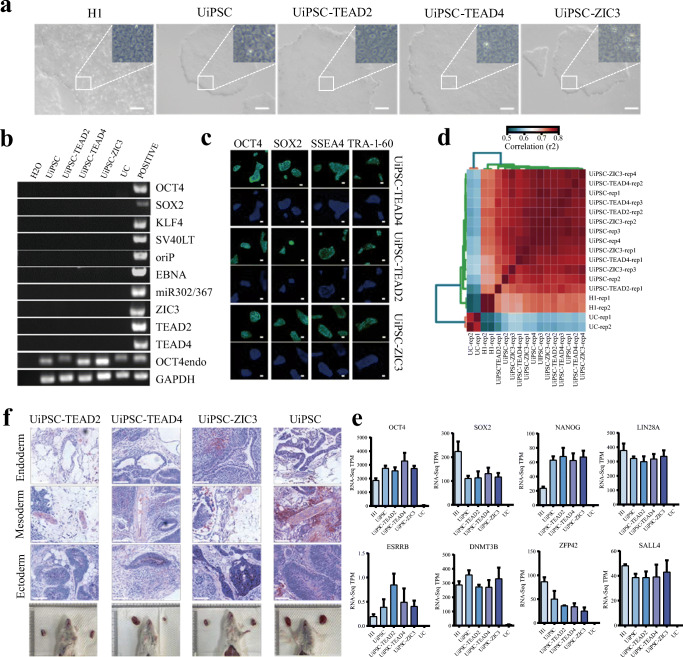
Characteristics of the reprogrammed UiPSCs-TEAD2, UiPSCs-TEAD4 and UiPSCs-ZIC3 cell lines. a The morphology of UiPSCs-TEAD2, UiPSCs-TEAD4 and UiPSCs-ZIC3 clones are similar to H1 and UiPSCs (bar: 200 μm). b Detection of exogenous reprogramming factor integration by PCR analysis using genomic DNA in the UiPSCs clones. c immunofluorescence images of the pluripotency markers (OCT4, SOX2 SSEA4 and TRA-1-60) in UiPSCs-TEAD2, UiPSCs-TEAD4 and UiPSCs-ZIC3 cells (bar: 50 μm). d The R2 correlation coefficient matrix of all versus all RNA-seq datasets as indicated. e The expression level for select pluripotent genes from RNA-seq data. Data represented as mean ± SEM from two replicates. f Teratoma assay of UiPSCs-TEAD2, UiPSCs-TEAD4, UiPSCs-ZIC3 and control UiPSCs. H&E staining was performed after 4 weeks subcutaneous injection, each image presents histology consistent with endoderm, mesoderm or ectoderm. (bar: 90 μm)

