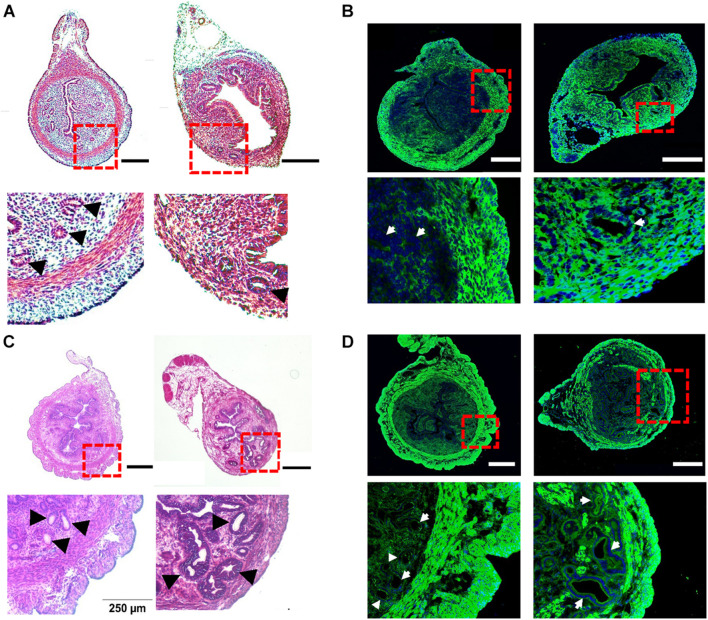
FIGURE 2.
Histological characteristics of tamoxifen-induced adenomyosis in neonatal and adult mice. (A) The hematoxylin–eosin (H–E) staining of uterine cross-sections from postnatal day (PND) 14 mice after treatment with the vehicle for preparing tamoxifen (left) or with tamoxifen (right). Insets in (A) and other panels in this figure are enlarged areas in dotted red line boxes. (B) The immunostaining of Myh11 (green) in uteri from PND14 mice after treatment with the vehicle (left) or with tamoxifen (right). The nucleus, shown in blue in this panel (and in panel D), was stained with DAPI. (C) The H–E staining of uterine cross-sections from PND55 mice after treatment with the vehicle (left) or with tamoxifen (right). (D) The immunostaining of Myh11 (green) in uteri from PND55 mice after treatment with the vehicle (left) or with tamoxifen (right). Note that (1) glands as marked by black arrowheads (A,C) or white arrows (B,D) were present in the circular smooth muscle in both PND14 and PND55 mice after tamoxifen treatment, but they were absent in vehicle control mice of both ages, and (2) circular muscle in both PND14 and PND55 mice were intact without interruption in vehicle control mice but were disrupted by endometrial glands in mouse uteri treated with tamoxifen. N = 4–6 mice. Scale bar: 200 μm (A,B); 500 μm (C,D).

