FIGURE 5.
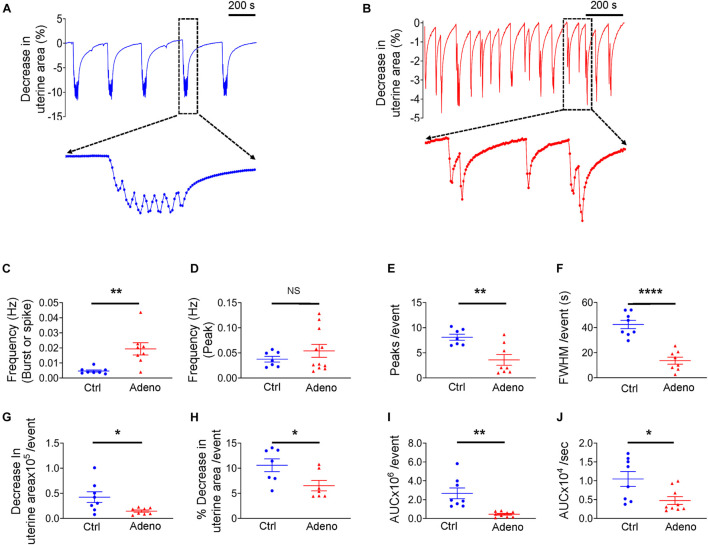
Changes in uterine peristalsis in adult adenomyotic mice. (A) Typical uterine peristalsis events in postnatal day (PND) 55 mice after treatment with the vehicle for tamoxifen (Ctrl). A burst event, marked with the dotted line box, is shown in an expanded time scale. (B) Typical uterine peristalsis events in PND55 mice after with tamoxifen (Adeno). Three events in the dotted line box are shown in an expanded time scale. (C) Frequency comparison between Ctrl mice and Adeno mice at PND55 when a burst or a spike was counted as one event (the same convention applied to panels E–J). (D) Frequency comparison between Ctrl mice and Adeno mice at PND55 when every peak was counted as one event. (E) Comparison of peak numbers/event between two group mice. (F) Full width at half maximum (FWHM)/event in two group mice. (G) Changes in uterine slice absolute areas/event in two group mice. (H) Changes in slice relative areas/event in two group mice. (I) Area under the curve (AUC)/event in two group mice. (J) Contraction intensity (AUC × Frequency) comparison between Ctrl and Adeno mice. Note that each data point in panels (C–J) is an average value from multiple slices in a mouse, and each slice was recorded for ∼1 h. N.S., no statistical significance, *P < 0.05, **P < 0.01, ****P < 0.0001 with unpaired Student’s t-test (N = 8 Ctrl mice (20–24 slices) and 8–11 Adeno mice (24–28 slices) for panels (C–J).

