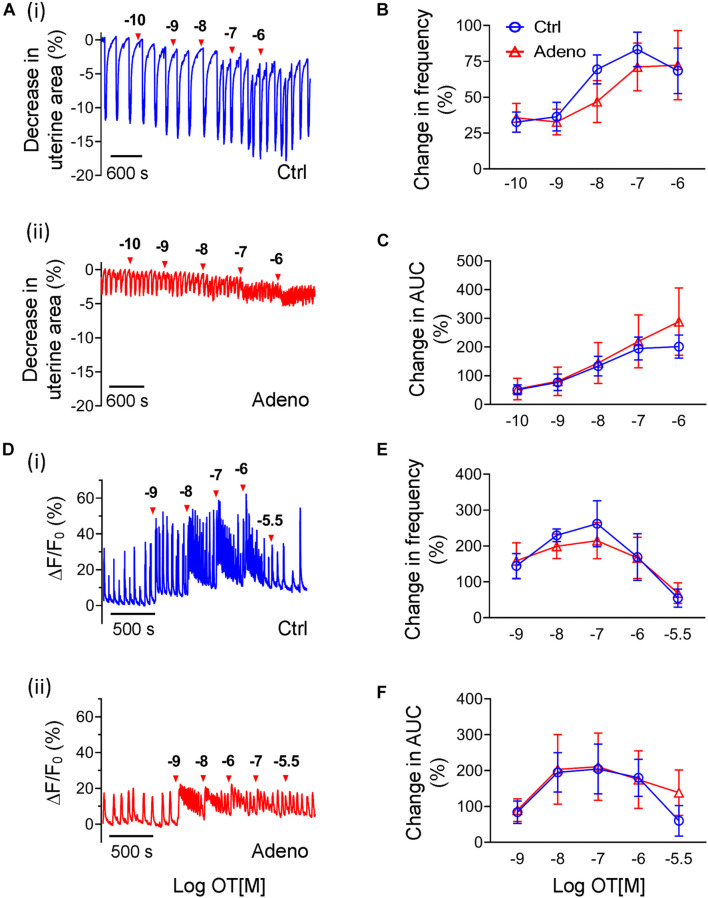
FIGURE 9.
Changes in oxytocin-induced uterine peristalsis and Ca2+ oscillations in adult adenomyotic mice. (A) Time courses of uterine peristalsis in response to accumulative oxytocin (OT) stimulation in postnatal day (PND) 55 mice after treatment with the vehicle for tamoxifen (Ctrl) [A(i)] and the same age mice after treatment with tamoxifen (Adeno) [A(ii)]. The concentrations of oxytocin are labeled above the traces. (B) Uterine peristalsis frequency changes caused by oxytocin in uterine slices from Ctrl (O; blue line) and Adeno (Δ; red line) mice at PND55. (C) Changes in the AUC of uterine peristalsis caused by OT in uterine slices from Ctrl (O) and Adeno (Δ) mice at PND55. (D) Time courses of Ca2+ oscillations in response to accumulative OT stimulation in Ctrl [D(i)] and Adeno mice [D(ii)] at PND55. The concentrations of OT are labeled above the traces. (E) Ca2+ oscillation frequency changes caused by OT in uterine slices from Ctrl (O; blue line) and adeno (Δ; red line) mice at PND55. (F) Change in the AUC of Ca2+ oscillations by OT in uterine slices from Ctrl (O; blue line) and Adeno (Δ; red line) mice at PND55. Note that a burst or a spike was counted as an event in this Figure (and Figure 10). N = 5 Ctrl mice (10 slices) and 5 Adeno mice (10 slices). A two-way ANOVA to compare individual groups shows no significant difference in panels (B,C,E,F).

