Figure 1.
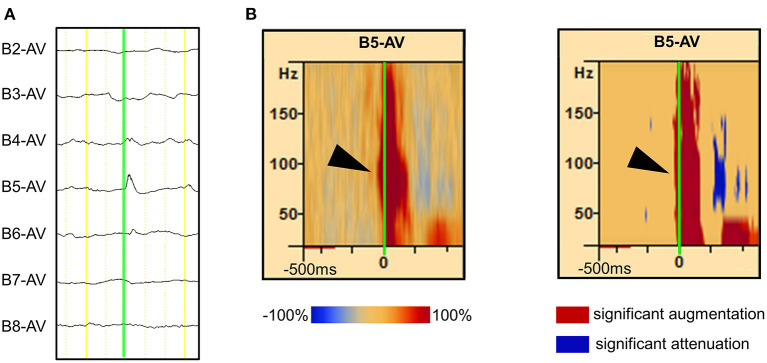
Detection of spike-related high-frequency oscillations (HFOs) using the BESA® software. (A) The rising edge of the negative spike is marked (green line) in the channel of interest [channel (Ch) B5 is used as an example in this figure]. More than 30 spikes were marked in the same channel. (B, left) The average HFO augmentation associated with the spikes was analyzed using BESA®. Within the square, the “percentage augmentation” of the Ch B5 spike-related HFOs relative to the reference (300–500 ms prior to the spike, red bar) is shown, ranging from −100% (blue) to +100% (red). The earliest HFO augmentation was observed between 80 and 150 Hz (arrowhead). (B, right) The blue color indicates the significant attenuation and the red color indicates the significant augmentation of amplitude in a given time–frequency bin relative to the reference period. The analysis was done using studentized bootstrap statistics. The corrected α level was set to 0.05.

