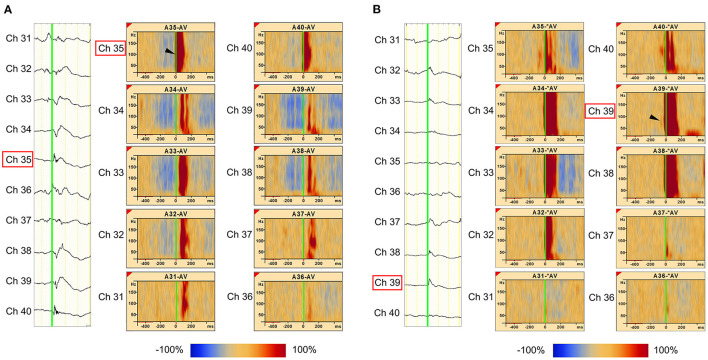
Figure 3.
Marked interictal spikes and spike-related ripples in Patient 1. Green lines on the rising edge of channel A35 (Ch 35) [negative spike (A, left)] and channel A39 (Ch 39) [negative spikes (B, left)] are shown. The time–frequency plots in the square show the augmentation of ripples related to Ch 35 spikes (A, right) and Ch 39 spikes (B, right). Augmentation of ripples ranges from −100% (blue) to 100% (red) relative to the reference period (−500 to −300 ms). In the middle column of Ch 35 spike-related ripples (A), the red bands from Ch 35 to Ch 31 show a progressively longer latency, which indicates propagation of ripples across these channels. The shortest latency of the Ch 35 spikes-related ripple augmentation channel (ripple onset) was visually estimated as Ch 35 (A, arrowhead), and the Ch 39 spikes-related ripple augmentation channel (ripple onset) was estimated as Ch 39 (B, arrowhead).

