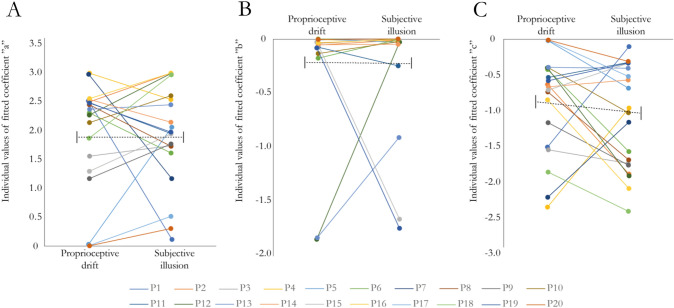
Fig. 6.
Comparison of the values of the coefficients for the fitted curves (a, b and c in the equation ) for the synchronous conditions in experiment 2. Panel A illustrates the coefficient “a” (intersect), panel B the coefficient “b” (decay) and panel C the coefficient “c” (constant). Individual data points and pairwise comparisons are shown for all participants (P1–P20). The black dotted lines illustrate mean and standard error of the mean (SEM). See Supplementary Fig. 4 for individual fitted curves and individual datapoints

