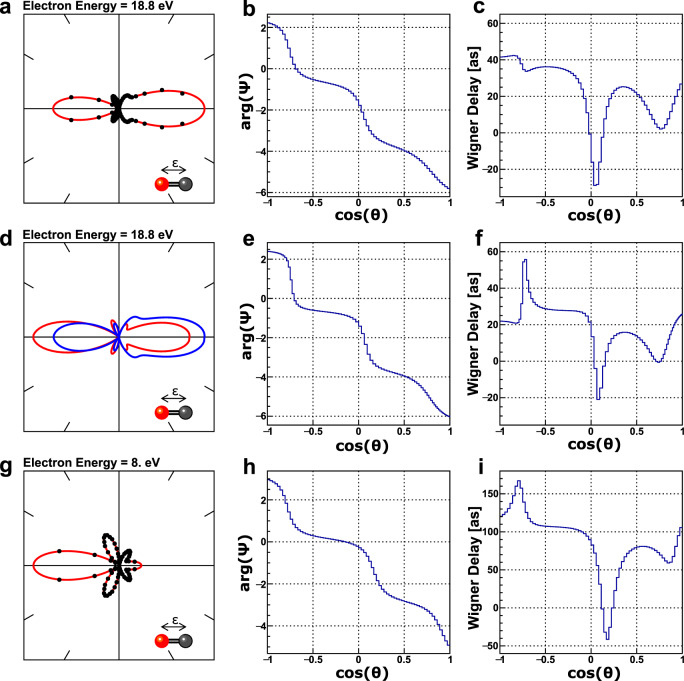
Fig. 2. Molecular-frame photoelectron angular distribution and extracted information for ε = 18.8 eV and ε = 8.0 eV.
a Example of the emission pattern of a core electron emitted from the carbon atom of a CO molecule (black dots) for an electron energy of ε = 18.8 eV. The electron has been ionized by linearly-polarized synchrotron light. The molecule is oriented horizontally and parallel to the polarization axis of the photons with the emitting carbon atom pointing to the right (as depicted by the inset). The rich angular features are caused by the scattering of the emerging electron wave by the molecular potential. The statistical error bars of the data points are smaller than the markers. b The extracted phase and c molecular-frame Wigner delay. The oxygen atom is located at , the carbon atom at . d–f Corresponding results obtained from our theoretical modeling of the photoemission process. The two lines in panel d belong to the modeling within the relaxed-core (red) and the frozen-core (blue) Hartree-Fock approximation. The phase and the Wigner delay shown in the panels e and f correspond to the relaxed-core Hartree-Fock approximation. g–i Experimental results obtained for an electron energy of ε = 8.0 eV, i.e., recorded on the Σ-shape resonance of the molecule.

