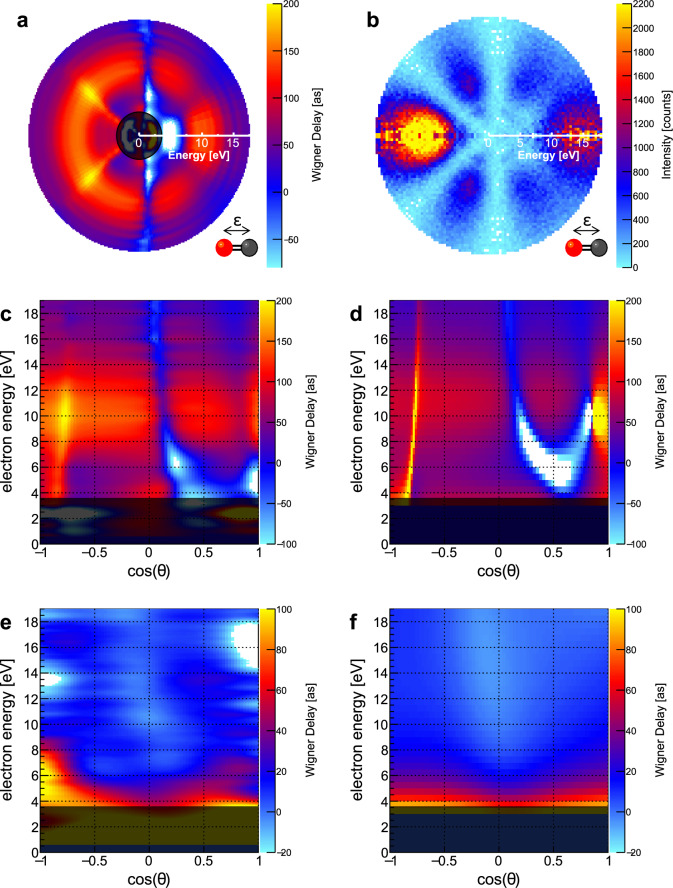
Fig. 3. Molecular-frame photoelectron angular distributions and Wigner delay maps.
a–d The molecule is oriented along the light’s polarization axis. a Angle-dependent Wigner delay for a range of electron kinetic energies (resulting from a scan of the photon energy). The electron energy is encoded in the distance from the center, while the value in [as] is encoded in the color scale. b Polar map of the molecular-frame photoelectron angular distribution in a corresponding representation. Distinct features in the Wigner delay occur under emission angles which depict minima in the angular emission distribution. c The same as in a but in a conventional color map representation. d Associated Wigner color map obtained from our theoretical modeling. e, f The same as c and d but for molecules oriented perpendicularly to the polarization axis of the incoming photons. For the energy region below 3.5 eV a different theoretical model would be necessary. Therefore, this region is grayed out in a and c–f.

