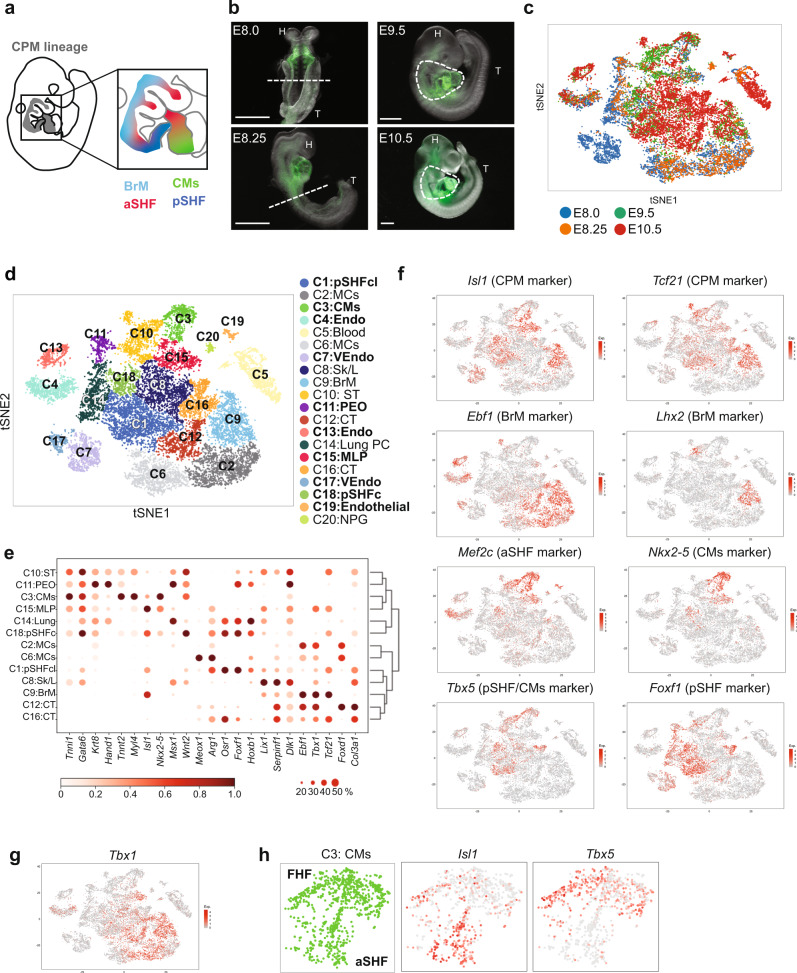
Fig. 1. Single-cell analysis of Mesp1 + lineages at E8.0 to E10.5 identifies CPM lineages.
a Cartoon of an E9.5 embryo in a right lateral view (left, CPM, gray). The CPM includes the branchiomeric muscle progenitor cells (BrM; aqua), anterior SHF (aSHF; red), and part of the posterior SHF (pSHF; blue). Because cardiomyocyte progenitors (CMs; green) are from both the FHF and CPM, only CPM-derived CMs are included. b Whole-embryo images with GFP fluorescence of Mesp1Cre; ROSA26-GFPf/+ embryos at E8.0, E8.25, E9.5, and E10.5 used for scRNA-seq. The white dotted line represents the region that was dissected. Only GFP-positive cells were used for scRNA-seq. H head, T tail. Scale bar E8.0, E8.25 is 750 µm; E9.5 and E10.5 is 500 µm. c t-distributed stochastic neighbor embedding (tSNE) plot colored by developmental stage. d tSNE plot colored by clusters (C1-20). Cardiac relevant clusters are in bold font. C1: pSHFcl, posterior CPM includes cardiac and lung progenitor cells; C2: MCs, mesenchyme expressing epithelial–mesenchymal transition markers; C3: CMs cardiomyocyte progenitor cells; C4: Endo endocardium and endothelial cells; C5: Blood blood cells; C6: MCs mesenchyme expressing epithelial–mesenchymal transition markers; C7: VEndo vascular endothelial cells; C8: Sk/L skeleton/limb progenitor cells; C9: BrM branchiomeric muscle progenitor cells; C10: ST septum transversum progenitor cells; C11: PEO proepicardial organ; C12: CT connective tissue progenitor cells; C13: Endo endothelial cells; C14: Lung PC lung progenitor cells; C15: MLP multilineage progenitor cells; C16: CT connective tissue progenitor cells; C17: VEndo vascular endothelial cells; C18: pSHFc posterior CPM of cardiac progenitor cells; C19: Endothelial cells; C20: NPG neural progenitor cells. e Heatmap of average gene expression of marker genes in representative clusters. Dot size indicates the fraction of cells expressing the genes in each cluster and color indicates scaled mean expression (bar below; dark red is the strongest expression). f, g tSNE plots showing expression of CPM marker genes (f) and Tbx1 (g). The color spectrum from gray to red indicates expression levels from low to high. h tSNE plots of CM progenitors showing the expression level of CM (Tbx5) and CPM (Isl1) marker genes.

