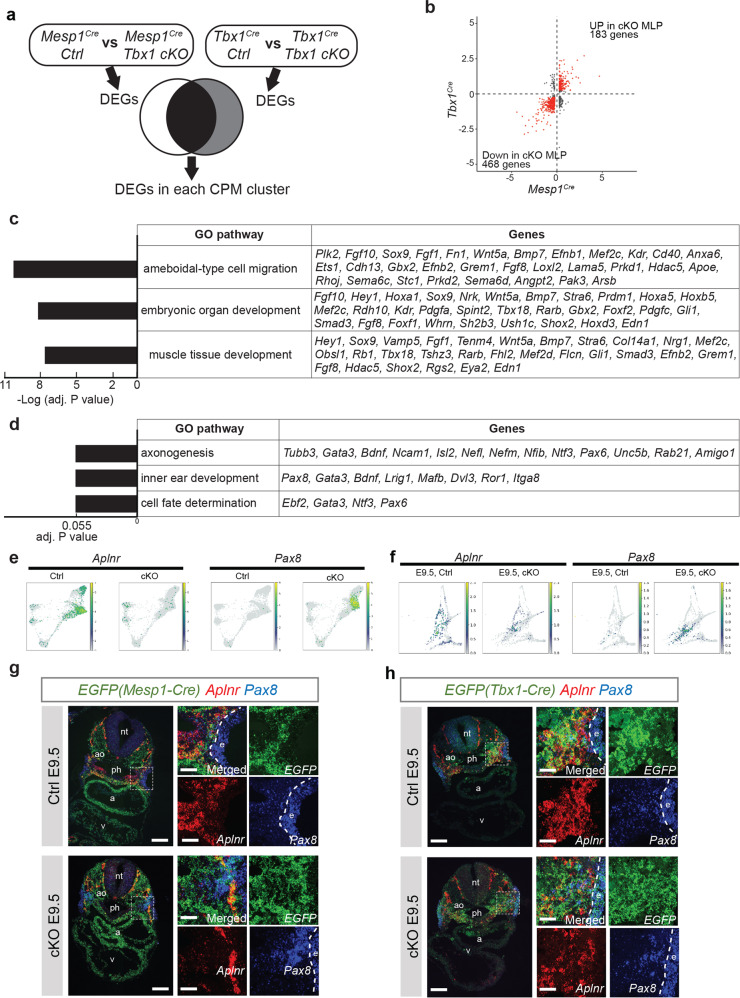
Fig. 6. Tbx1 is required in MLPs to promote lineage progression and restrict the expression of ectopic genes.
a The cartoon of analysis strategy focus on DEGs in the CPM that are shared between both lineages (black). b Comparison of differentially expressed genes (DEGs) from Mesp1Cre/+; ROSA26-GFPf/+ (Ctrl) vs Mesp1Cre/+; ROSA26-GFPf/+;Tbx1f/f (cKO) embryos at E9.5 and Tbx1Cre/+; ROSA26-GFPf/+ (Ctrl) vs Tbx1Cre/f; ROSA26-GFPf/+ (cKO) in MLPs. X axis indicates log2-fold change of Mesp1Cre DEGs. Y axis indicates the log2-fold change of Tbx1Cre DEGs. Each dot indicates a gene, and red indicates common DEGs with |log2-fold change | > 0.25 in both comparisons. c, d Enriched biological processes in gene ontology (GO) and related genes found in downregulated (c) or upregulated (d) genes in MLPs of Tbx1 cKO. X axis indicates adjusted P values. e Single-cell embedding graph of the CPM lineages from Mesp1Cre Ctrl and cKO at E9.5 separated by genotype and colored by expression level (gray to blue, green, yellow, low to high). f Single-cell embedding graph of the CPM lineages from Tbx1Cre Ctrl and cKO at E9.5 datasets separated by genotype and colored by expression level (gray to blue, green, yellow, low to high). g RNAscope in situ hybridization with EGFP (green), Aplnr (red), and Pax8 (blue) mRNA probes on the transverse section from Mesp1Cre/+;ROSA26-GFPf/+;Tbx1f/+ (Ctrl) embryos (upper panel; n = 3) and Mesp1Cre/+;ROSA26-GFPf/+;Tbx1f/f (cKO) embryos (lower panel; n = 3) at E9.5. Scale bar, 100 µm. The white dotted line indicates the position in higher magnification images shown in the right. Scale bar, 30 µm. h RNAscope in situ hybridization with EGFP (green), Aplnr (red), and Pax8 (blue) mRNA probes on the transverse section from Tbx1Cre/+;ROSA26-GFPf/+ (Ctrl) embryos (upper panel; n = 3) and Tbx1Cre/f;ROSA26-GFPf/+ (cKO) embryos (lower panel; n = 3) at E9.5. Scale bar, 100 µm. The white dotted line indicates the position in higher magnification images shown in the right (scale bar, 30 µm. a atrium, ao aorta, e ectoderm, nt neural tube, ph pharynx, v ventricle.

