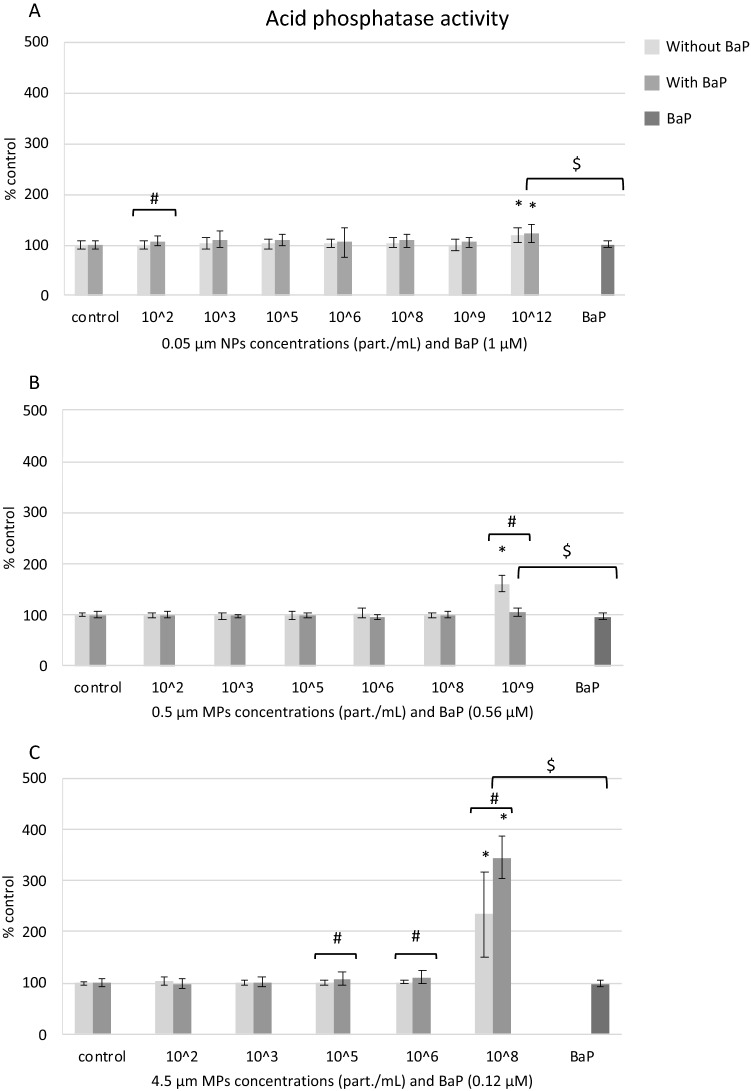
Figure 6.
Lysosomal AcP activity in mussel hemocytes exposed for 24 h to (A) 0.05 µm NPs, (B) 0.5 µm MPs and (C) 4.5 µm MPs alone or in combination with BaP and to BaP alone. Data are given as percentages with respect to control ± SD (n = 18). * indicates significant differences with respect to controls, # indicates significant differences between NPs/MPs with or without BaP and $ indicates significant differences between NPs/MPs with BaP and BaP alone.

