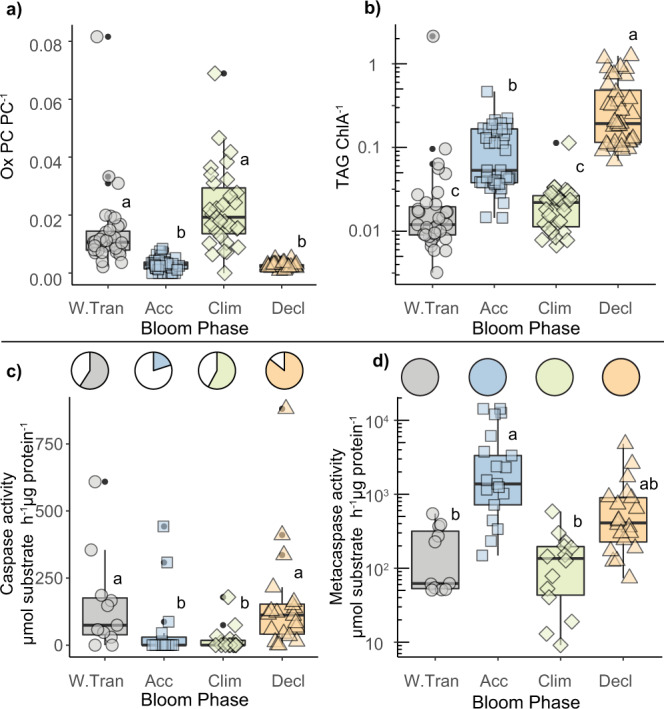
Fig. 3. Seasonal phases are characterized by distinct lipid profiles and cell death-associated proteolytic activity.

a Oxidized phosphatidylcholine (OxPC40:10, OxPC42:11, OxPC44:12) normalized to total phosphatidylcholine (PC40:10, PC42:11, PC44:12). b Triacylglycerol (TAG; pmol L−1), normalized to ChlA (peak area/L). c (top) The proportion of in situ samples with positive caspase activity (cleavage of IETD-AFC; color shading). (bottom) Caspase-specific activity rates (µmol substrate hydrolyzed h−1 µg protein−1) for in situ populations. d (top) The proportion of in situ samples with positive metacaspase activity (cleavage of VRPR-AMC; color shading). (bottom) Metacaspase-specific activity rates (µmol substrate hydrolyzed h−1 µg protein−1) for in situ populations. All box plots represent the median value bounded by the upper and lower quartiles, with whiskers representing median + quartile × 1.5. Different letters denote statistically significant groups (p < 0.05, Kruskal−Wallis test with Dunn corrections for multiple comparisons). Intergroup comparisons with more than one letter denote no significant difference between the two groups. Lipids and enzyme activities derived from biomass collected within the mixed layer at depths associated with 40, 20, or 1% surface irradiance (see ‘Methods’). Individual symbols in all panels represent biological replicates and are colored and shaped by bloom phase. Seasonal phases are indicated in each panel (W.Tran = Winter Transition; Acc = Accumulation; Clim = Climax; Decl = Decline). Number of biological replicates, by bloom phase (from left to right) = 35, 37, 31, 36 (a), 35, 41, 36, 35 (b), 11, 15, 15, 20 (c), 11, 17, 14, 20 (d). Exact p values can be found in Source Data file.
