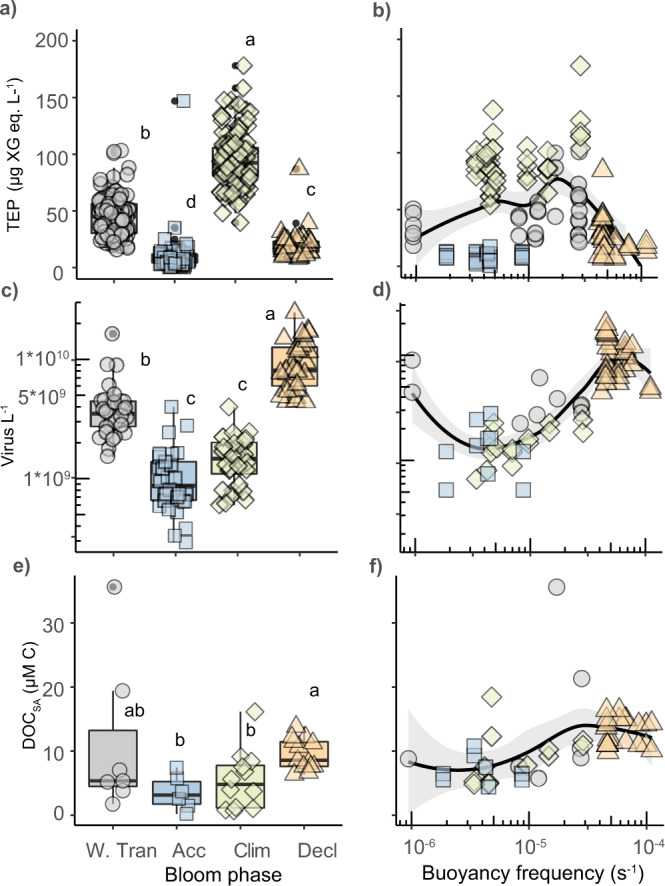
Fig. 4. Seasonal phases are characterized by distinct extracellular signatures in aggregation potential, virus particle concentration, and DOC accumulation.

Concentrations of a, b transparent exopolymer particles (TEP: µg Xanthan Gum equivalents L−1), c, d virus-like particles (Virus L−1), and e, f seasonally accumulated dissolved organic carbon (DOCSA: μM carbon) within the mixed layer at depths corresponding to 40, 20, or 1% surface irradiance for different seasonal phases (W.Tran = Winter Transition; Acc = Accumulation; Clim = Climax; Decl = Decline). Panels (b), (d), (f) show a subset of samples (corresponding to 5 m sampling depth) plotted as a function of water column stratification (LOESS, shaded area = 95% confidence interval) (buoyancy frequency; s−1). Lower buoyancy frequency values to the right of the plot are more stratified. Individual symbols represent biological replicates and are shaped and colored by bloom phase. Box plots represent the median value bounded by the upper and lower quartiles with whiskers representing the median + quartile × 1.5 Different letters denote statistically significant groups (p < 0.05, Kruskal−Wallis test with Dunn corrections for multiple comparisons). Intergroup comparisons with more than one letter denote no significant difference between the two groups. Number of biological replicates, by bloom phase (from left to right) = 95, 73, 101, 55 (a), 30, 32, 32, 32 (c), 7, 6, 12, 12 (e). Exact p values can be found in Source Data file.
