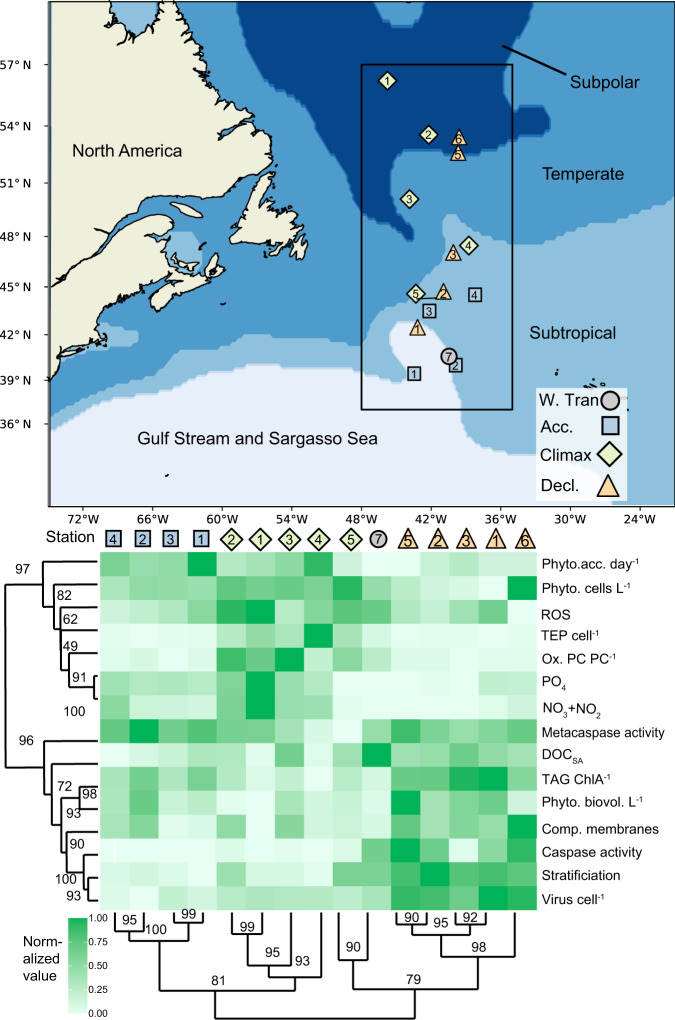
Fig. 6. Comparison of biomarker signatures between stations and bloom phases in the NAAMES study area.
(Top) Map of stations within subregions and bloom phases used in this analysis. Only stations with in situ values of all of the biomarkers in the heatmap below were included, except for accumulation rates, which were calculated from on-deck incubations. Stations with more than one sampling date were consolidated into a single latitude and longitude for the purpose of this map. Stations are shaped and colored by bloom phase:W. Tran = Winter Transition, Acc. = Accumulation, Climax, Decl. = Decline. (Bottom) Heatmap of normalized values of biomarkers throughout the bloom. The median value at each station, within the mixed layer was normalized to the highest and lowest median values throughout the bloom. Dendrogram clustering was done with the average method, using a correlation distance matrix of normalized values. Bootstrap values (n = 1000) are pvclust’s AU p value—higher is more significant. Rows and columns were ordered using Dendrogram cluster order. Phytoplankton acc. day−1 = cell concentration-based accumulation rate (day−1); Phyto. cells L−1 = phytoplankton concentration (cells L−1); ROS = Reactive oxygen species (log10 fold change from unstained); TEP cell−1 = transparent exopolymer particle concentration (µg XG eq. L−1) normalized to phytoplankton and bacteria concentrations; Ox.PC PC−1 = oxidized phosphatidylcholine normalized to total phosphatidylcholine; PO4 = phosphate concentration (µM); NO3 + NO2 = nitrate plus nitrite concentration (µM); Metacaspase activity = µmol metacaspase substrate cleaved h−1 µg protein−1; DOCSA = seasonally accumulated dissolved organic carbon (µM change from minimum value per bloom phase); TAG ChlA−1 = triacylglycerol (µM) normalized to Chlorophyll A peak area/L; Phyto. biovol. L−1 = phytoplankton biovolume (µL L−1); Comp. membranes = % of population with compromised membranes; Caspase activity = µmol caspase substrate cleaved h−1 µg protein−1; Stratification = measured water column buoyancy frequency (s−1); Virus cell−1 = virus concentrations normalized to phytoplankton and bacteria concentrations.

