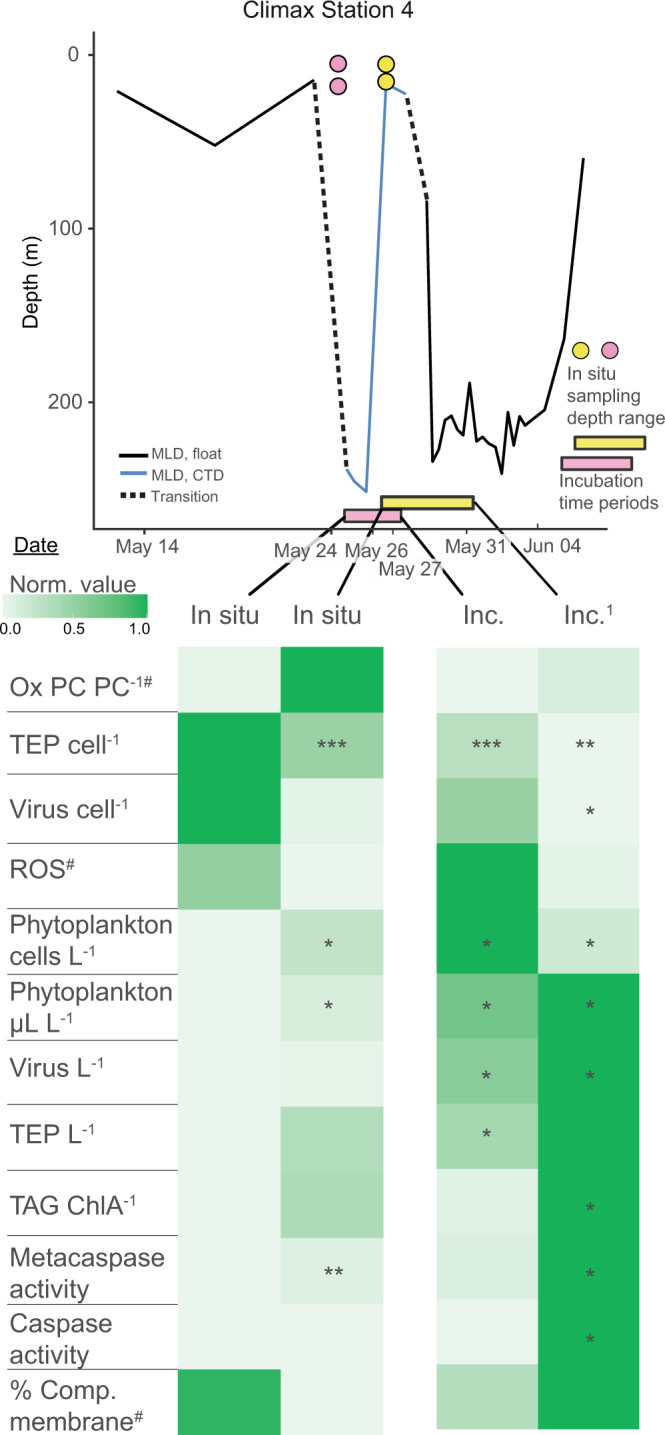
Fig. 8. Physiological state of phytoplankton transitioning from a deep to a shallow mixed layer.

(Top) Mixed layer depth at Climax Station 4 in relation to sampled phytoplankton communities. Solid black line represents mixed layer depth (MLD) pre- and post-occupation provided by drifting BioArgo floats (solid black line). A dashed line represents the transition from the float-measured MLD to ship-measured MLD (solid blue line), since sampling was done near and not directly at the float. Water sampled from the first and third days of occupation are indicated by pink and yellow symbols, respectively. The y axis positions of colored circles represent sampling depths. The x axis position of colored circles represents the date of sampling. Colored bars on the x axis correspond to incubation times of sampled communities (colored circles were the source water). (Bottom) Comparison of intra- and extracellular biomarkers from phytoplankton associated with in situ and incubation samples from above. Color shading in each row represents the normalized distribution of each parameter over the 8-day transition from a deeply mixed to a shallow mixed layer. Row order is clustered by optimal leaf algorithm. Data for incubations derive from the same in situ water collected on days 1 and 3, respectively, and incubated on deck at in situ light and temperature (see ‘Methods’). Asterisks indicate significant differences from day 1 via Kruskal−Wallis test (*p < 0.05, **p < 0.01, ***p < 0.001). Ox PC PC− 1 = oxidized phosphatidylcholine normalized to total PC; TEP cell−1 = transparent exopolymer particles normalized to phytoplankton and bacterial cell concentrations; Virus cell−1 = virus concentration normalized to phytoplankton and bacterial cell concentrations; ROS = reactive oxygen species; Phytoplankton cells L−1 = phytoplankton cell concentration; Phytoplankton µl L−1 = phytoplankton biovolume; Virus L−1 = virus concentration; TEP L−1 = transparent exopolymer concentration; TAG ChlA−1 = triacylglycerol concentration (pM) normalized to chlorophyll A peak area/L; Metacaspase activity = µmol metacaspase substrate cleaved, µg protein−1 h−1; Caspase activity = µmol caspase substrate cleaved, µg protein−1 h−1; % Comp. membrane = % of population with compromised membranes. 1Incubation samples from depths lower than 5 m were lost due to a storm knocking the incubation tanks off the deck. #n < 3 samples for at least 1 day for these parameters, due to loss of samples in transit or lack of sampling on day 1. See Supplementary Fig. 12 for raw parameter data from this station. Exact p values can be found in Source Data file.
