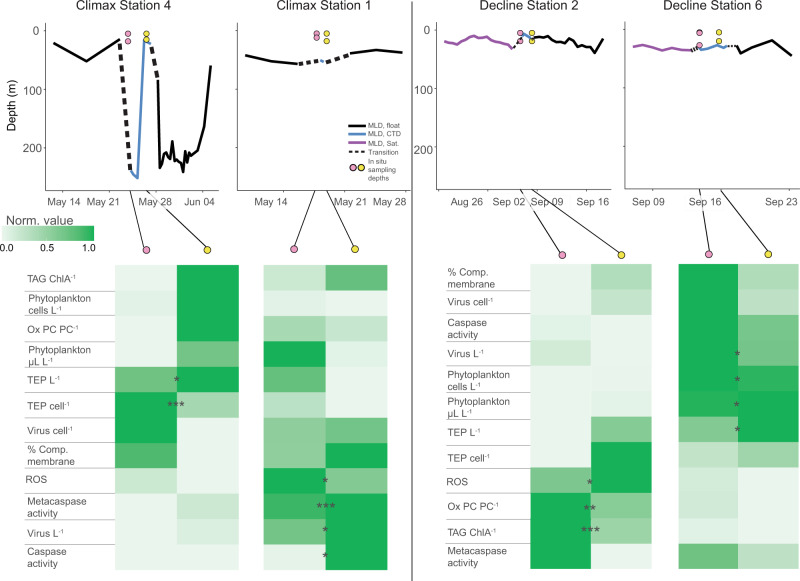
Fig. 9. Inter-station comparisons of phytoplankton physiological state in water columns with different mixing depths and biomass loads.
(Top) Mixed layer depth dynamics at a subset of Climax and Decline stations in relation to sampled phytoplankton communities. Climax Station 4 transitioned from a deeply mixed to a shallow water column, while Climax Station 1 had more consistent MLDs during station occupation. More stable and shallow MLDs were observed during Decline phase, but phytoplankton communities had different relative biomass levels (Decline Station 6, high; Decline Station 2, low). Pre- and post-occupation mixed layer depths (MLD) are provided by drifting BioArgo floats (solid black line) or derived from satellite measurements (purple line), since BioArgo floats were not available for the Decline phase. A dashed line represents the transition from the float-measured MLD to ship-measured MLD (solid blue line), since sampling was done near and not directly at the float. y axis positions of colored circles represent sampling depths of in situ populations. x axis position of colored circles represents the date of sampling. Dates and data corresponding to colored symbols are used in the comparison table below. (Bottom) Comparison of intra- and extracellular biomarkers for phytoplankton associated with in situ samples from above. Pink symbols = first day of occupation. Yellow symbols = subsequent day of occupation. Rows represent a two-day time course of each measured biomarker variable. Color shading represents the normalized distribution of each parameter within each seasonal phase to better illustrate relative responses to MLD dynamics. Row order is clustered by optimal leaf algorithm. Asterisks indicate significant differences between stations, via Kruskal−Wallis test (*p < 0.05, **p < 0.01, ***p < 0.001). Biomarker definitions are the same as in Fig. 8. OxPC PC−1 also used additional data from the 1% light depth due to some samples being lost in transit. See Supplementary Fig. 13 for raw parameter data from these stations. Exact p values be found in Source Data file.

