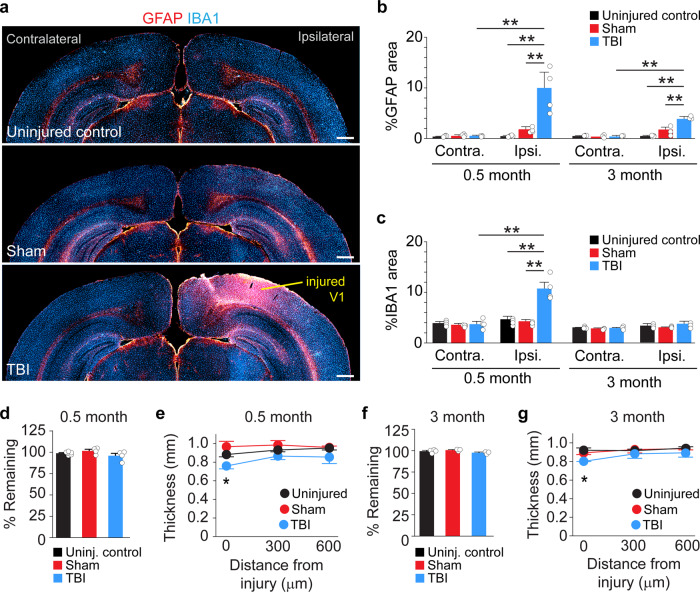
Fig. 1. Visual cortex TBI produces a mild cortical lesion.
a Coronal sections of GFAP (red) and IBA1 (blue) labeling in a control animal and 0.5 months after sham or CCI injury. b Quantification of GFAP expression in V1 at 0.5 and 3 months postinjury. **P = 2.9E-07, ipsilateral control versus ipsilateral TBI; **P = 1.3E-05, ipsilateral sham versus ipsilateral TBI; **P = 1.3E-06, ipsilateral TBI versus contralateral TBI at 0.5 months; **P = 1.3E-06, ipsilateral control versus ipsilateral TBI; **P = 8.7E-05, ipsilateral sham versus ipsilateral TBI; **P = 6.0E-06, ipsilateral TBI versus contralateral TBI at 3 months two-way ANOVA with Tukey’s post hoc test, N = 3–6 mice per group. c Quantification of IBA1 expression in V1 at 0.5 and 3 months postinjury. **P = 2.4E-08, ipsilateral control versus ipsilateral TBI, **P = 2.9E-08, ipsilateral sham versus ipsilateral TBI, **P = 2.3E-08, ipsilateral TBI versus contralateral TBI at 0.5 months; two-way ANOVA with Tukey’s post hoc test, N = 3–6 mice per group. d Quantification of cortical tissue volume in control, sham, and CCI-injured mice 0.5 months post-CCI. e Average thickness of cortex with distance from the injury 0.5 months post-CCI. *P = 0.048, Control versus TBI, two-way repeated-measures ANOVA with Tukey’s post hoc test, N = 4–6 mice per group. f Quantification of cortical tissue volume in control, sham, and CCI-injured mice 3 months post-CCI. g Average cortex thickness with distance from the injury 3 months post-CCI. *P = 0.023, Uninjured versus TBI, two-way repeated-measures ANOVA with Tukey’s post hoc test, N = 3–4 mice per group. Scale bars, 500 µm; error bars, SEM.

