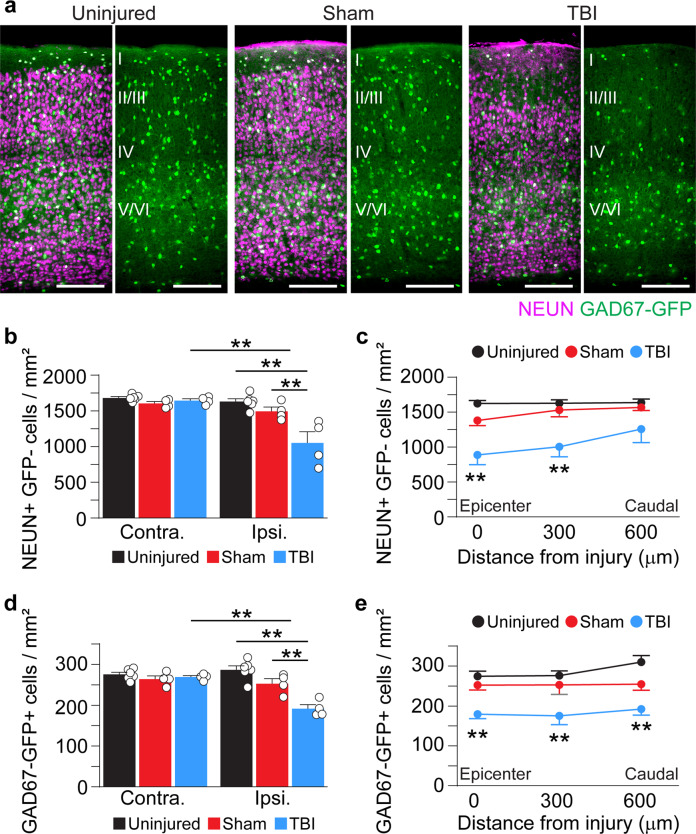
Fig. 2. Neuron loss in V1 0.5 months after TBI.
a Coronal images of control, sham, and CCI-injured V1 labeled for NEUN (magenta) and GAD67-GFP (green). b Quantification of NEUN+/GFP- cell density in uninjured control, sham, and brain-injured mice 0.5 months after CCI. **P = 1.79E-05, ipsilateral control versus ipsilateral TBI, **P = 1.77E-03, ipsilateral sham versus ipsilateral TBI, **P = 4.56E-05, ipsilateral TBI versus contralateral TBI; two-way ANOVA with Tukey’s post hoc test, N = 4–6 mice per group. c NEUN+/GFP- cell density at 0–600 µm from the injury epicenter. **P = 7.86E-05, control versus TBI (0 μm), **P = 1.01E-03, control versus TBI (300 μm); two-way repeated-measures ANOVA with Tukey’s post hoc test; N = 4–6 mice per group. d Quantification of GAD67-GFP+ cell density in uninjured control, sham, and brain-injured mice 0.5 months after CCI. **P = 1.07E-06, ipsilateral control versus ipsilateral TBI, **P = 1.58E-03, ipsilateral sham versus ipsilateral TBI, **P = 9.25E-05, ipsilateral TBI versus contralateral TBI, two-way ANOVA with Tukey’s post hoc test, n = 4–6 per group. e GAD67-GFP+ cell density at 0–600 µm from the injury epicenter. **P = 3.53E-03, control versus TBI (0 μm), **P = 1.66E-03, control versus TBI (300 μm), **P = 1.74E-04, control versus TBI (600 μm); two-way repeated-measures ANOVA with Tukey’s post hoc test; N = 4–6 mice per group. Scale bars, 500 μm; error bars, SEM. See Supplementary Data 1 for statistical analyses.

