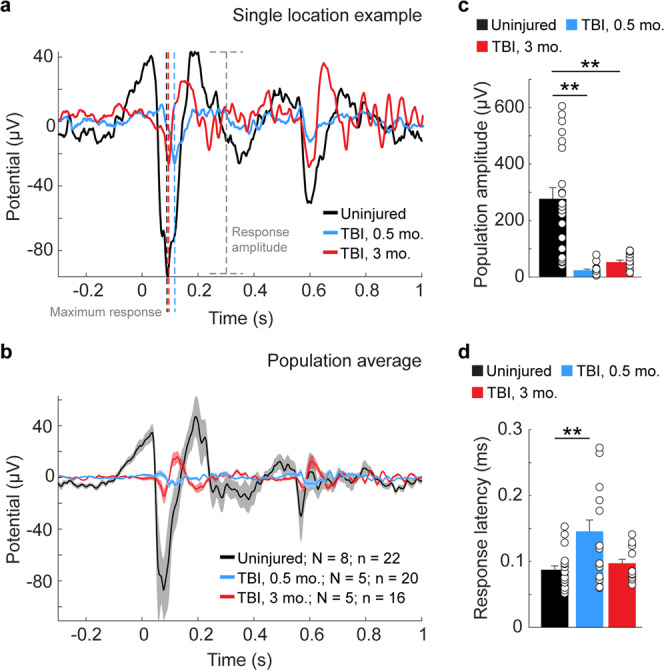
Fig. 5. TBI disrupts V1 responses to visual stimuli.

a Representative example of VEPs in layer 5 of an uninjured control animal (black trace) and animals 0.5 months (blue trace) and 3 months after CCI (red trace). The maximum response for each trace is indicated by dotted black, blue and red lines. Response amplitude for the control condition is indicated by the dotted gray line. b Average evoked potentials from recording sites in uninjured control (black) and 0.5 months (blue) and 3 months (red) after TBI. N = number of animals; n = number of recording locations. Shading indicates S.E.M. c Quantification of average evoked amplitude. **P = 6.23E-09, control versus 0.5 months after TBI; **P = 1.88E-03, control versus 3 months after TBI; Kruskal–Wallis H with Dunn’s post hoc. d Quantification of average response latency. **P = 0.02, control versus 0.5 months after TBI, Kruskal–Wallis H with Dunn’s post hoc. Individual data points represent the value for each of the recording locations. N, animals; n, recording location; error bars, SEM.
