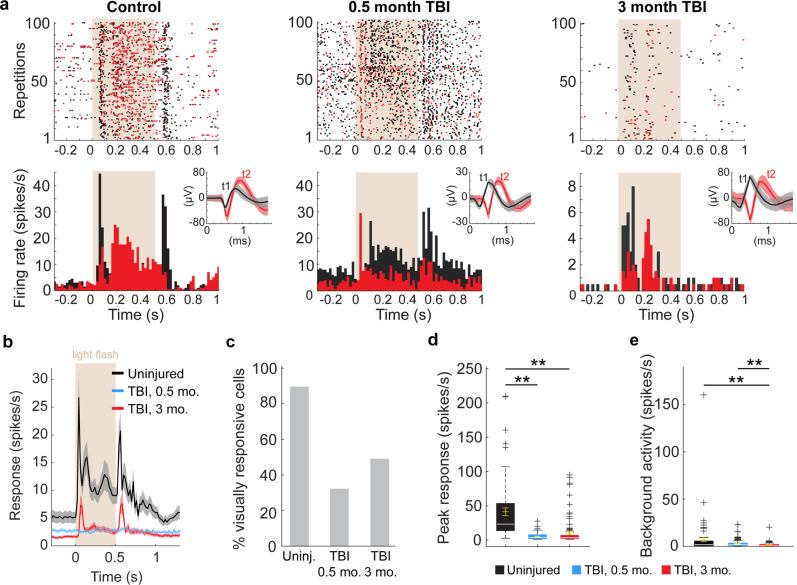
Fig. 6. Reduced V1 neuron firing following TBI.
a Light-evoked responses of action potential firing for two example neurons (black and red) for each animal group: control (left), 0.5 months (middle) and 3 months after injury (right). The top row shows raster plots to 100 repetitions of the flash stimulus. The bottom row shows the spikes/s averaged over 20 ms bins. In both rows, the 500 ms light stimulus is indicated by beige background shading. Insets in the upper right of the bottom row show raw wave forms isolated by two templates (t1, black and t2, red) based on differences in spike amplitude (uV) and timing (ms). Shading indicates spike variability. b Population averages of light-evoked single-unit responses of action potential firing in uninjured controls (black) and CCI-injured mice 0.5 months (blue) and 3 months after injury (red). n = 67 cells from 8 controls, 110 cells from 5 mice 0.5 months after TBI, and 115 cells from 5 mice 3 months after TBI. Shading indicates S.E.M. The 500 ms light stimulus is indicated by beige background shading. c. Percentage of visually responsive cells. d Quantification of peak single-neuron firing rates from each group in response to light stimulus. **P = 9.56E-10, control versus 0.5 months after TBI, **P = 9.56E-10, control versus 3 months after TBI; Kruskal–Wallis H with Dunn’s post hoc. e Quantification of single-neuron firing rates from each group in the 500 ms prior to the light stimulus. **P = 2.00E-03, control versus 0.5 months after TBI, **P = 3.02E-04, control versus 3 months after TBI; Kruskal–Wallis H with Dunn’s post hoc. For box plots, dashed error bars represent the maximum and minimum observations within 1.5 inter-quartile range of the 25th and 75th percentile; values greater than 1.5 inter-quartile range of the 75th percentile are indicated by +.

