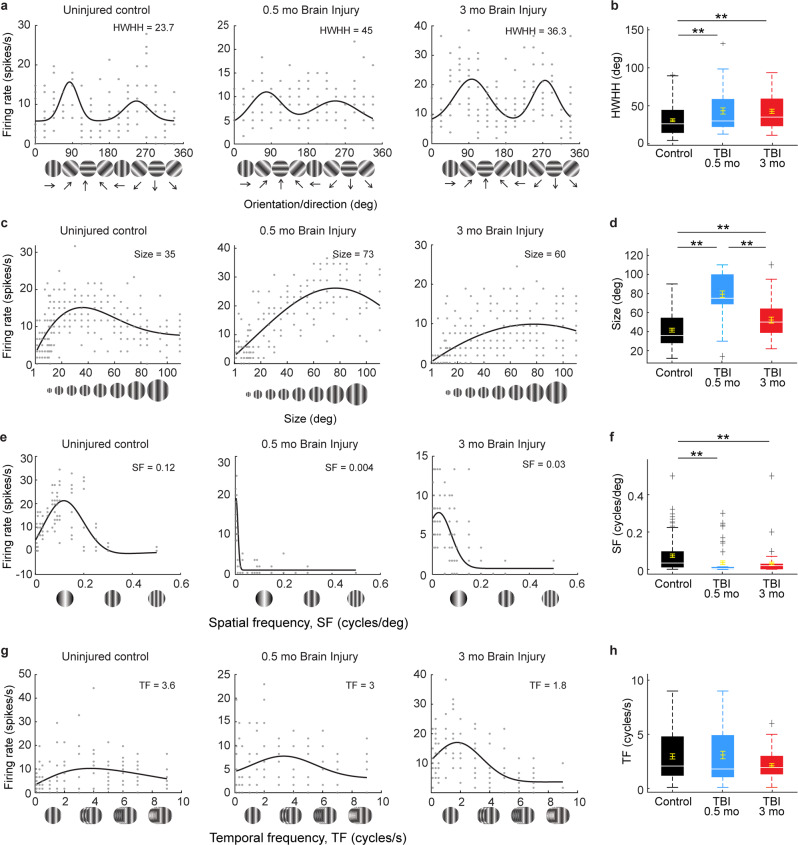
Fig. 7. TBI disrupts V1 neuron tuning curves in response to drifting gratings.
a, b Orientation tuning curves for single neurons in an uninjured control (black) and CCI-injured mice 0.5 months (blue) and 3 months (red) after injury. To facilitate comparisons across examples orientation preferences have been aligned to 90° and 270°, with 90° representing the preferred direction. Tuning values are given as the half-width at half-height (HWHH) in degrees in each panel (a) and the population averages are quantified in (b). **P = 0.03, control versus 0.5 months after TBI, **P = 1.99E-03, control versus 3 months after TBI; Kruskal–Wallis H with Dunn’s post hoc. n = 109 cells from 7 uninjured controls, 54 cells from 5 mice 0.5 months after TBI, and 75 cells from 5 mice 3 months after TBI. c, d Single neuron examples and population average quantification of aperture size (in degrees). **P = 9.56E-10, control versus 0.5 months after TBI, *P = 0.042, control versus 3 months after TBI, **P = 2.04E-05, 0.5 versus 3 months after TBI; Kruskal–Wallis H with Dunn’s post hoc. n = 81 cells for control, 45 cells 0.5 months after TBI and 41 cells 3 months after TBI. e, f Single neuron examples and quantification of spatial frequency (SF). **P = 3.80E-06, control versus 0.5 months after TBI, **P = 6.51E-03, control versus 3 months after TBI, Kruskal–Wallis H with Dunn’s post hoc. n =105 cells for control, 55 cells 0.5 months after TBI, 71 cells 3 months after TBI. g, h Single neuron examples and quantification of temporal frequency (TF). P = 0.26; Kruskal–Wallis H test. Optimal values for each parameter are given in each panel. n = 95 cells for control, 59 cells 0.5 months after TBI, and 70 cells 3 months after TBI. Background activity for each cell is indicated by gray dashed lines. For box plots, dashed error bars represent the maximum and minimum observations within 1.5 inter-quartile range of the 25th and 75th percentile; values greater than 1.5 inter-quartile range of the 75th percentile are indicated by +.

