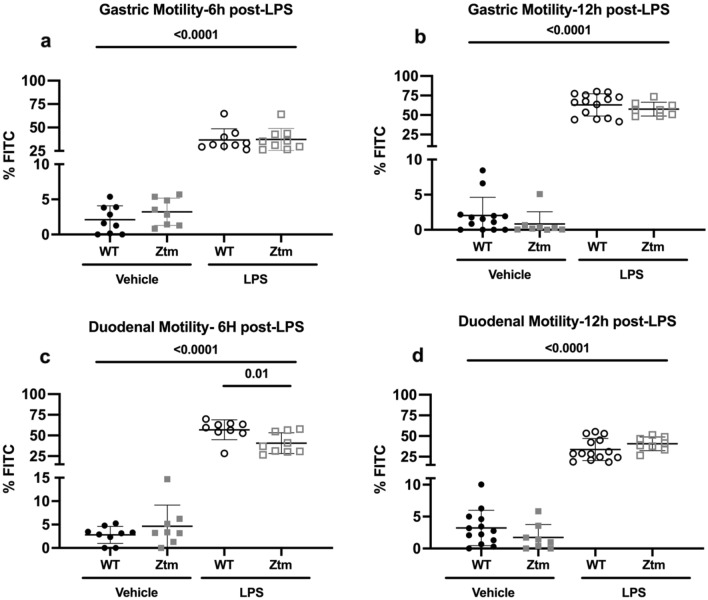
Figure 4.
Gastric and duodenal percent of FITC-dextran. Percent FITC-dextran in the first three segments of the small intestine were summed and represent the duodenum. Individual values per mouse are represented. One-way ANOVA, p < 0.05. Long bars represent the statistical analysis between vehicle- and LPS-injected mice. Filled circles—WT vehicle-injected; Filled squares—Ztm vehicle-injected; Open circles—WT LPS-injected; Open squares—Ztm LPS-injected.

