Fig. 13.
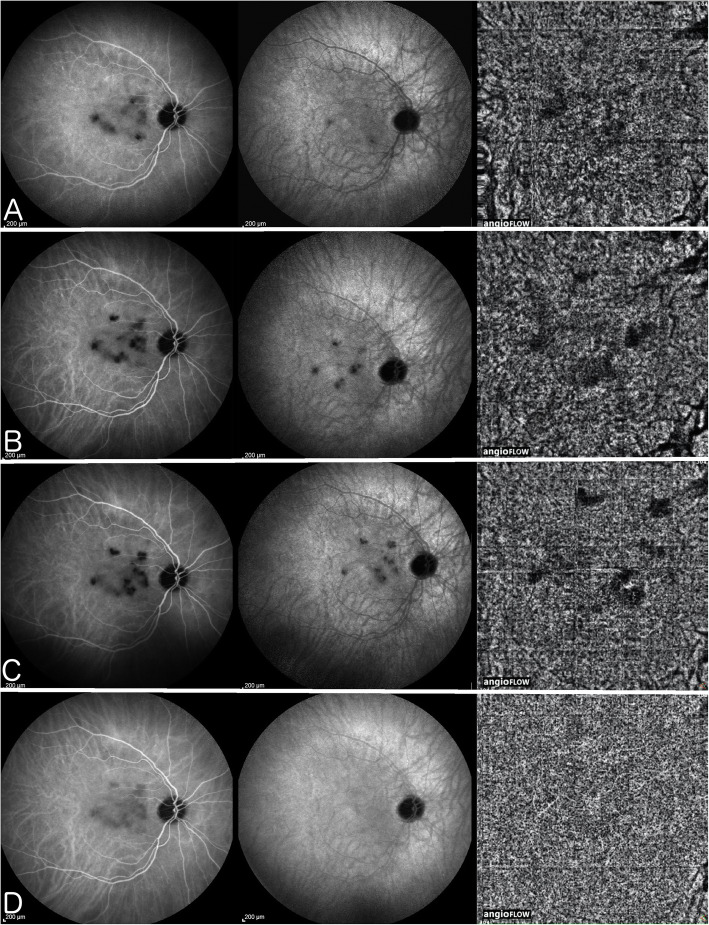
Serpiginous choroiditis - Parallel images of intermediate phase ICGA (left column), late phase ICGA (middle column) and 6x6mm OCT-Angiography (right column) of the right eye during follow-up
ICGA of the right eye reveals macular hypofluorescent lesions better seen in the intermediate phase ICGA (left column) corresponding to choroidal hypo or non-perfused areas. These lesions increase in size and number (A) (B) (C) until aggressive immunosuppression is introduced (D); OCT-A pictures evolve in parallel with ICGA frames with faint dark areas visible (A, B, and C – right column), and disappearing after aggressive immunosuppression is introduced (D, right); involvement of extended areas depending on larger vessels, probably precapillary arterioles, are needed to produce a drop-out on OCT-A.

