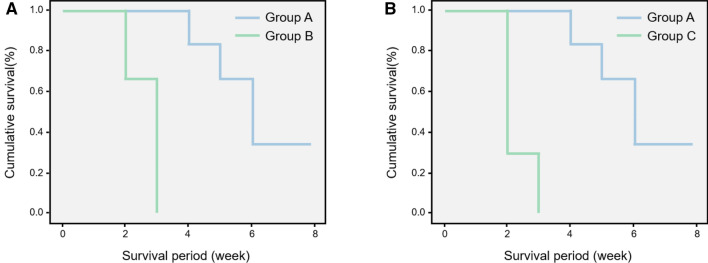
Fig. 13.
A, B Survival curves comparing Groups A and B and Groups A and C. Group A survived two-fold longer than the other groups, demonstrating clinically cured status (p = 0.03, p = 0.04, respectively). There was no difference between Groups B and C with respect to death due to tumor progression, and were shorter than in Group A

