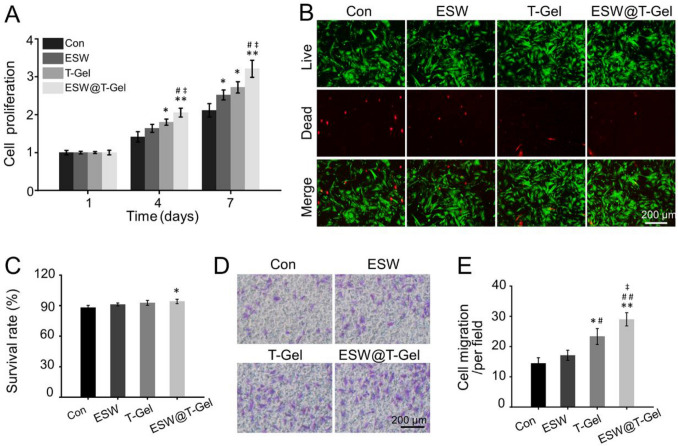
Fig. 3.
A Effects of different treatment groups on cell proliferation. B Calcein-AM/PI staining indicated the live cells were stained with green and the dead cells were stained with red. C Quantitative analysis of cell survival rate by Calcein AM/PI staining. D The images of migration cells were stained with crystal violet by Transwell test. E Quantitative statistics of the number of migrating cells (*p < 0.05, **p < 0.01 compared with Con group; #p < 0.05, ##p < 0.01 compared with ESW group; ‡p < 0.05 compared with T-Gel group)

