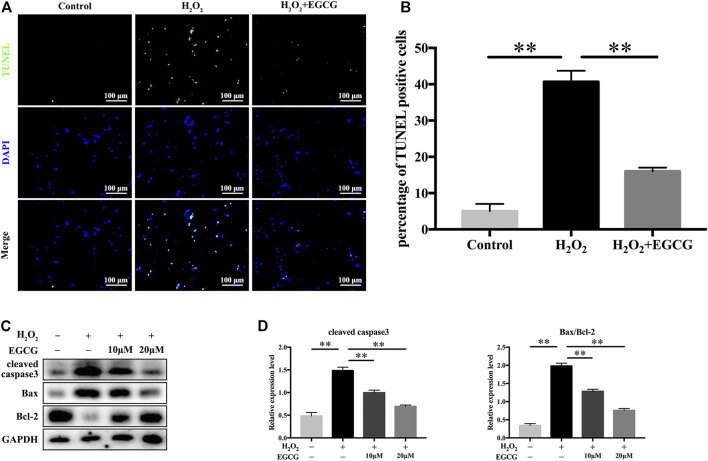
FIGURE 3.
EGCG inhibits H2O2-induced NPCs apoptosis. (A) NPC apoptosis levels in every treatment group was measured by TUNEL assay, and (B) TUNEL-positive cells were quantified. (C) Western blot assay for cleaved caspase3, Bax, as well as Bcl-2 expression levels following treatment with varying EGCG doses (with or without 300 μM H2O2 treatment) for 24 h. (D) Levels of various signal intensities. GAPDH was the loading control. Data are shown as mean ± SD (n = 3). * p < 0.05, ** p < 0.01.

