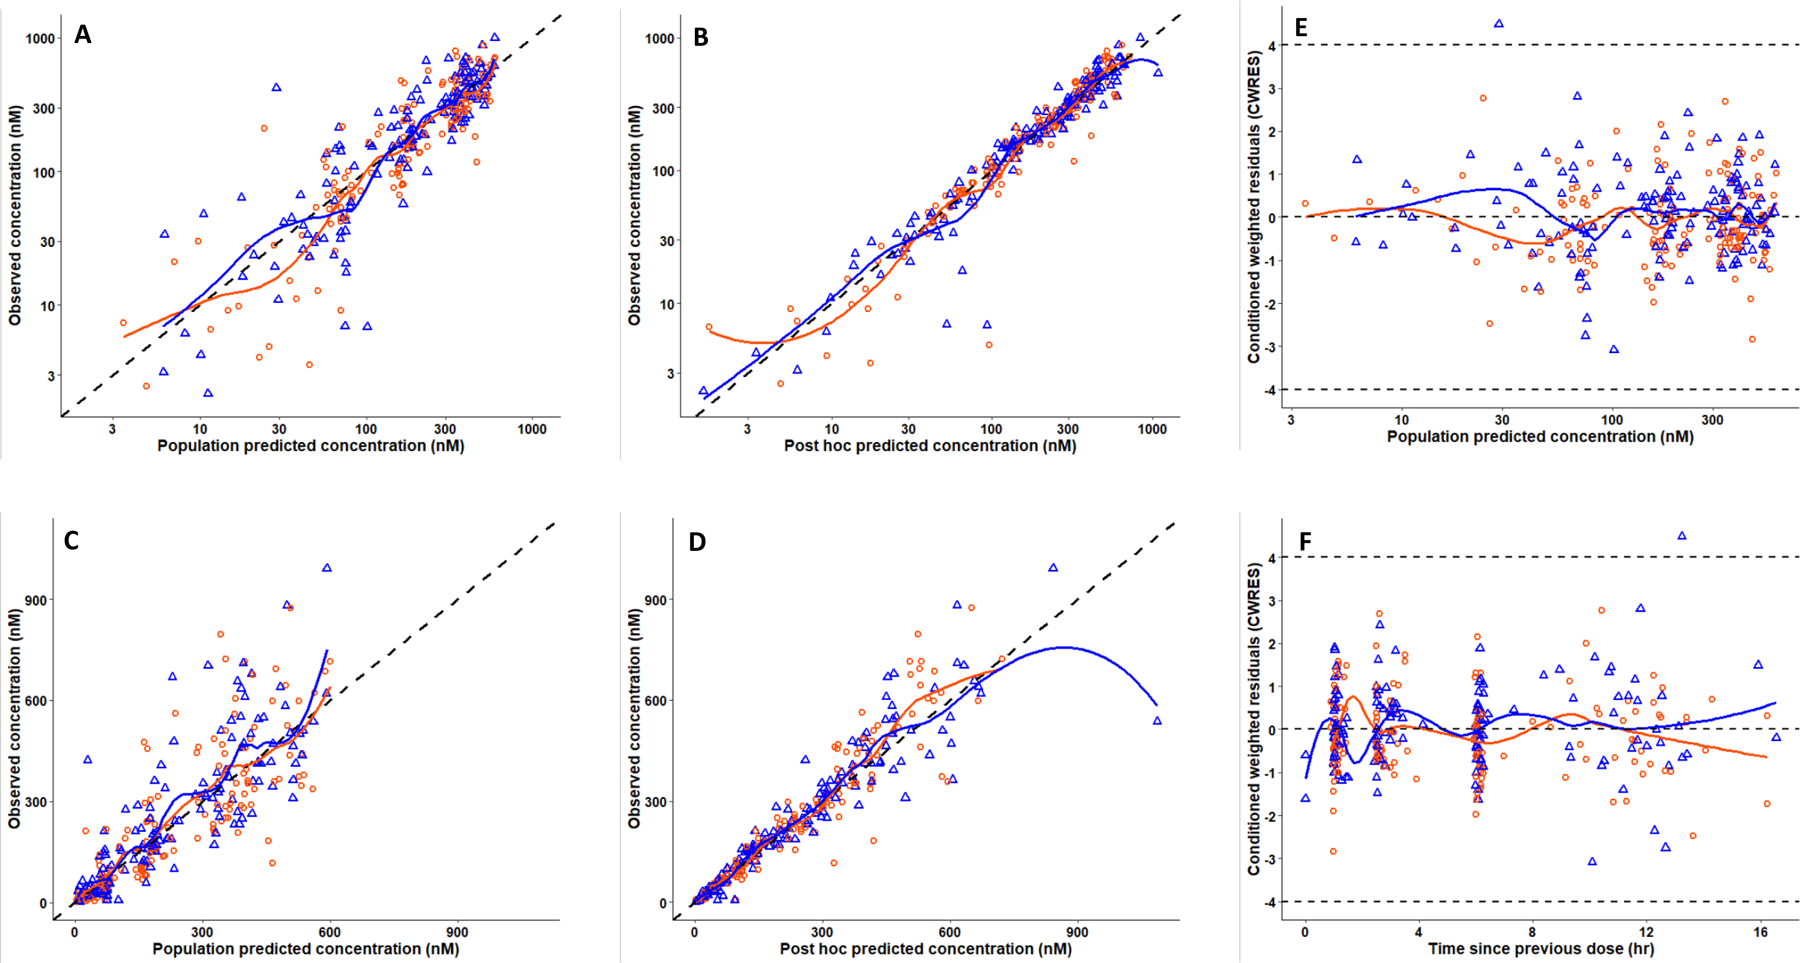
Figure 6.

Model IV goodness of fit curves of ruxolitinib population PK (separate CL/F by EFV status). Observed concentrations from wk1 (orange circles) and wk4/5 (blue triangles) versus the population predictions (A) and post hoc (individual) predictions (B) plotted on a log-scale. The same data are depicted on the arithmetic scale (C and D). The black dashed lines represent lines of identities. Plots The right-hand side panels depict conditional weighted residuals (CWRES) versus population predicted concentration (E) and times since the previous dose (F). Orange and blue curves are LOESS regression smoothers. The dashed gray line in panels E and F represents CWRES +4 and −4.
