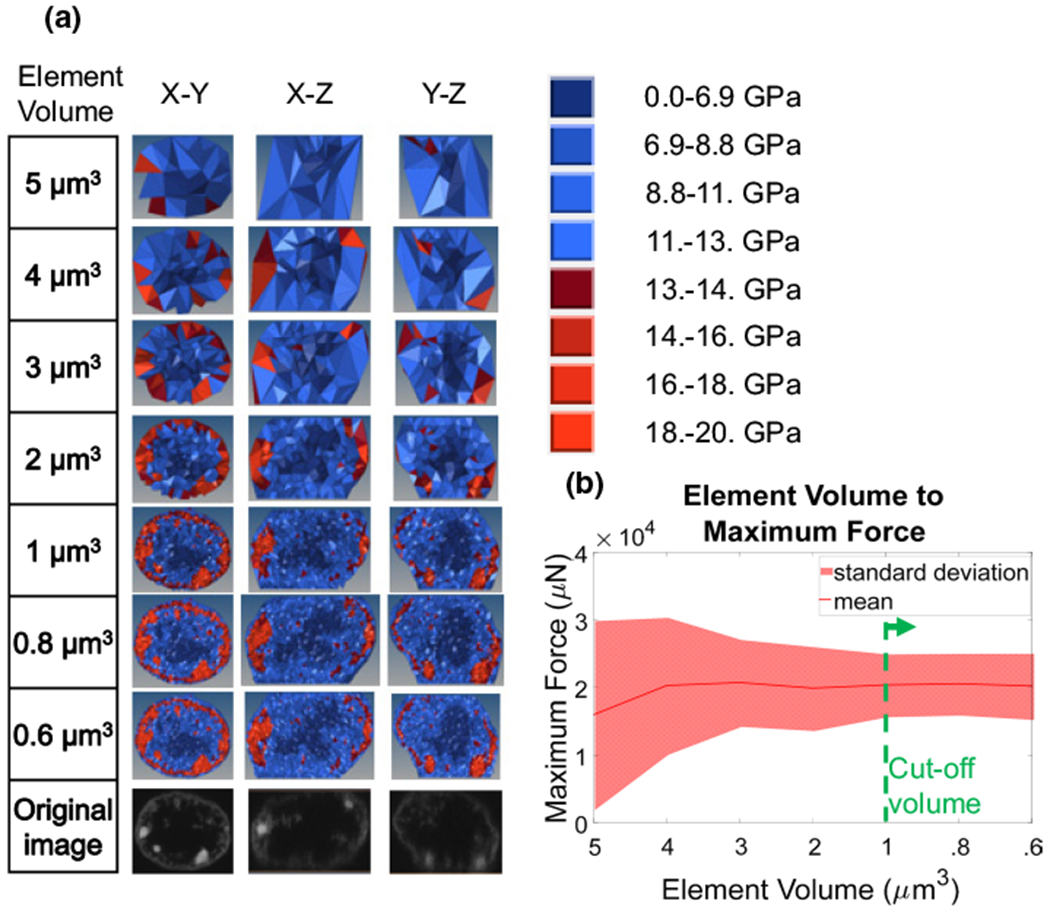
Fig. 3.

Element size sensitivity analysis. a Cross-sectional images of nuclei models created with elements that have an average element size of 5, 4, 3, 2, 1, .8 and .6 μ m3. Material parameters were set to b = 20 kPa and c = 1. Color maps indicate the corresponding stiffness values. b Graph of how maximum force, measured at the AFM tip pressing onto the nucleus, versus the element size averaged for three nuclei. The solid line represents the mean, and the shaded area indicates the area within one standard deviation. Element sizes smaller than 1 μ m3 did not affect maximum force and standard deviation (green dashed line)
