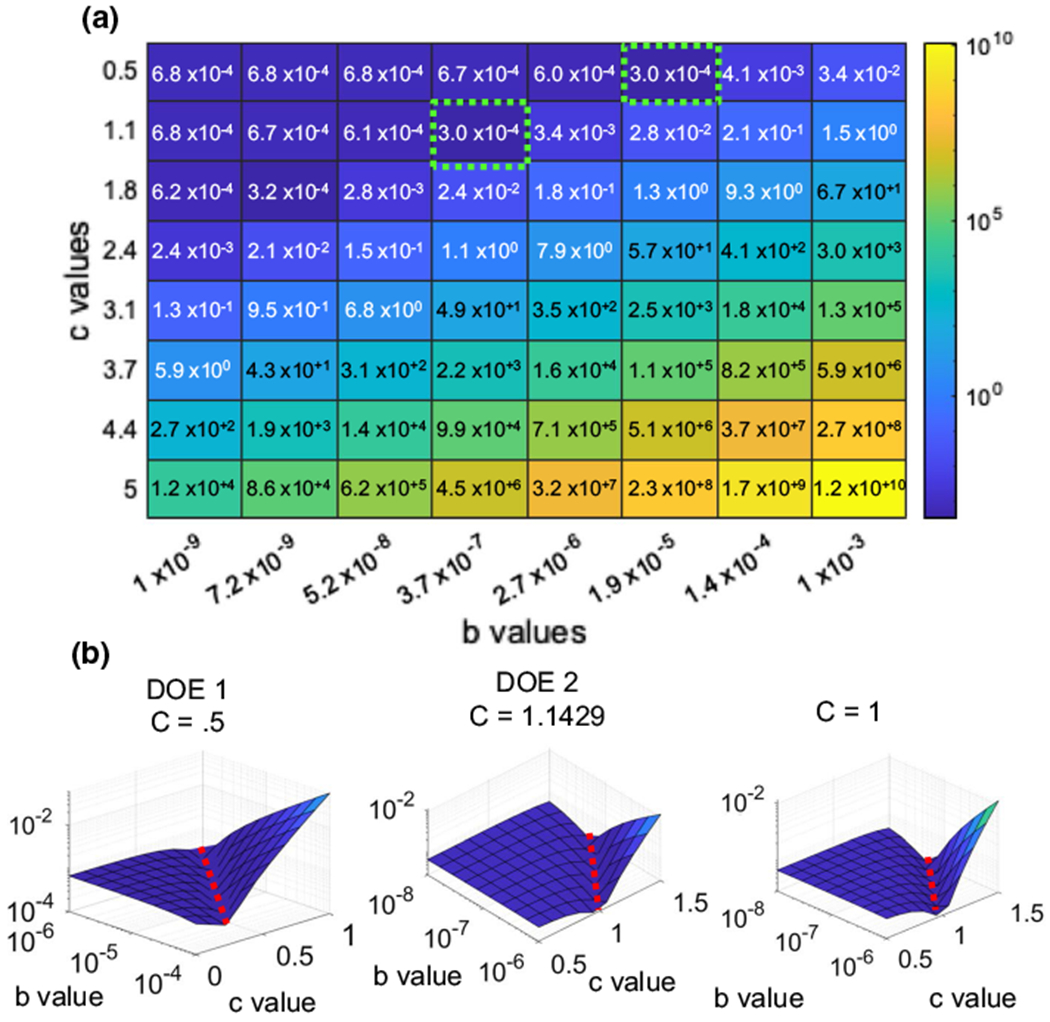
Fig. 6.

Optimization data for control nuclei using linear and exponential conversion factors. a Error surfaces for 3 control nuclei show a rut-like error when using different b and c values. b Higher resolution error surfaces were then done around the lowest points of the original surface, these error surfaces produces minimum values around 10−4 similar to the error surface generated around c = 1 showing that there is a correlation between b and c
