Fig. 7.

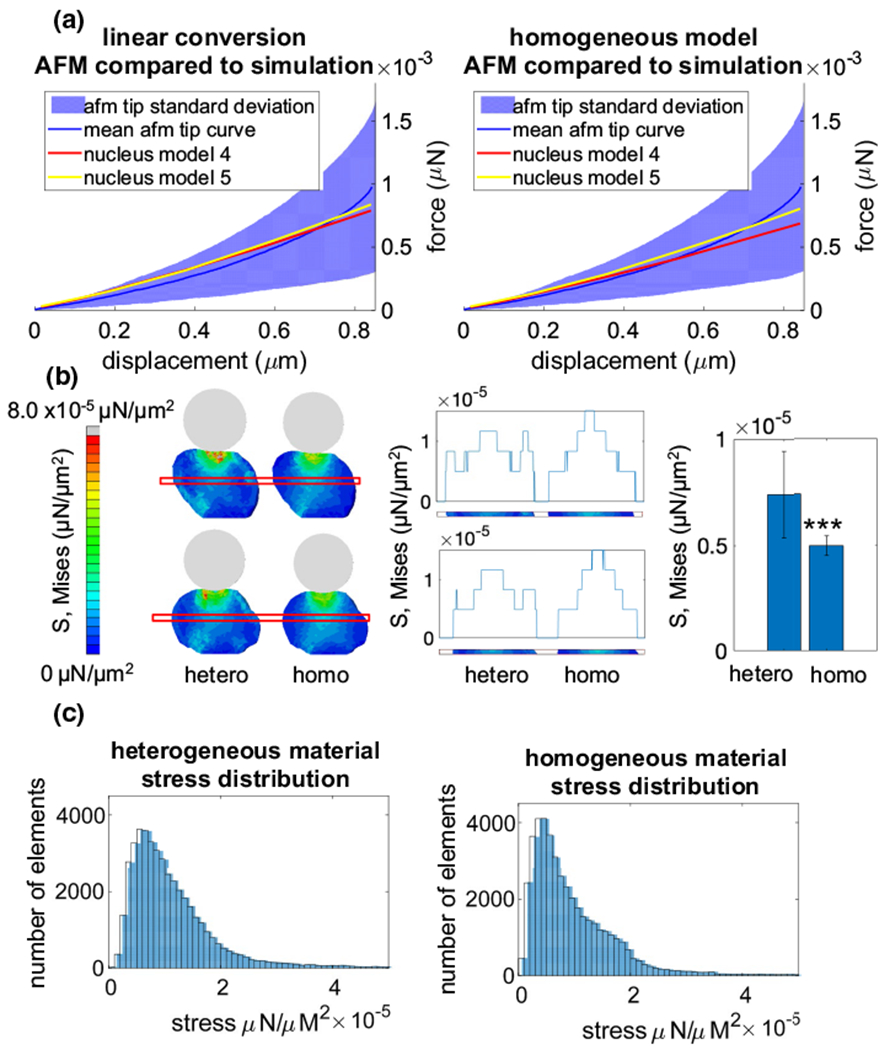
Linear conversion vs homogeneous model for chromatin. a The simulated force curves were superimposed onto the Lamin A/C KO results, comparing the resulting force curves from the linear conversion (left) to the results of the homogeneous model (right). b Cross sections of the model when fully compressed were imaged (left) and the average stresses within a 1 μm tall region beginning at a height of Z = 5 μm were plotted (middle). Stresses within the outer 25 percentile of both nuclei were plotted with a bar plot (right), showing the difference between the stress distributions within the homogeneous and heterogeneous models.Please refer to Fig. S4 for other nuclei images. c Von Mises stress data were collected from the elements of both models at maximum AFM tip compression and plotted within a histogram to show the difference between the stresses developed within the homogeneous and heterogeneous models
