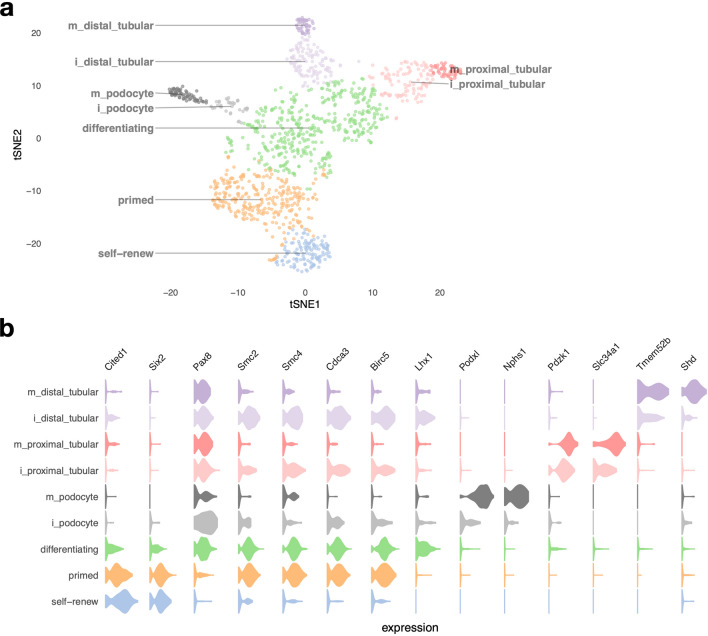
Figure 2.
Cell types of the nephron progenitor lineage. (a) shows a tSNE plot of NP-derived cells, with clusters corresponding to cell types indicated by colors. The prefix “i_” indicates immature cells, while “m_” indicates mature cells. (b) shows violin plots of gene expression for known lineage-associated genes (columns), stratified by cluster (rows). We observe two types of NP cells (“self-renewing” and “primed”) and clear separation of distal and proximal tubular cells and podocytes in our data.

