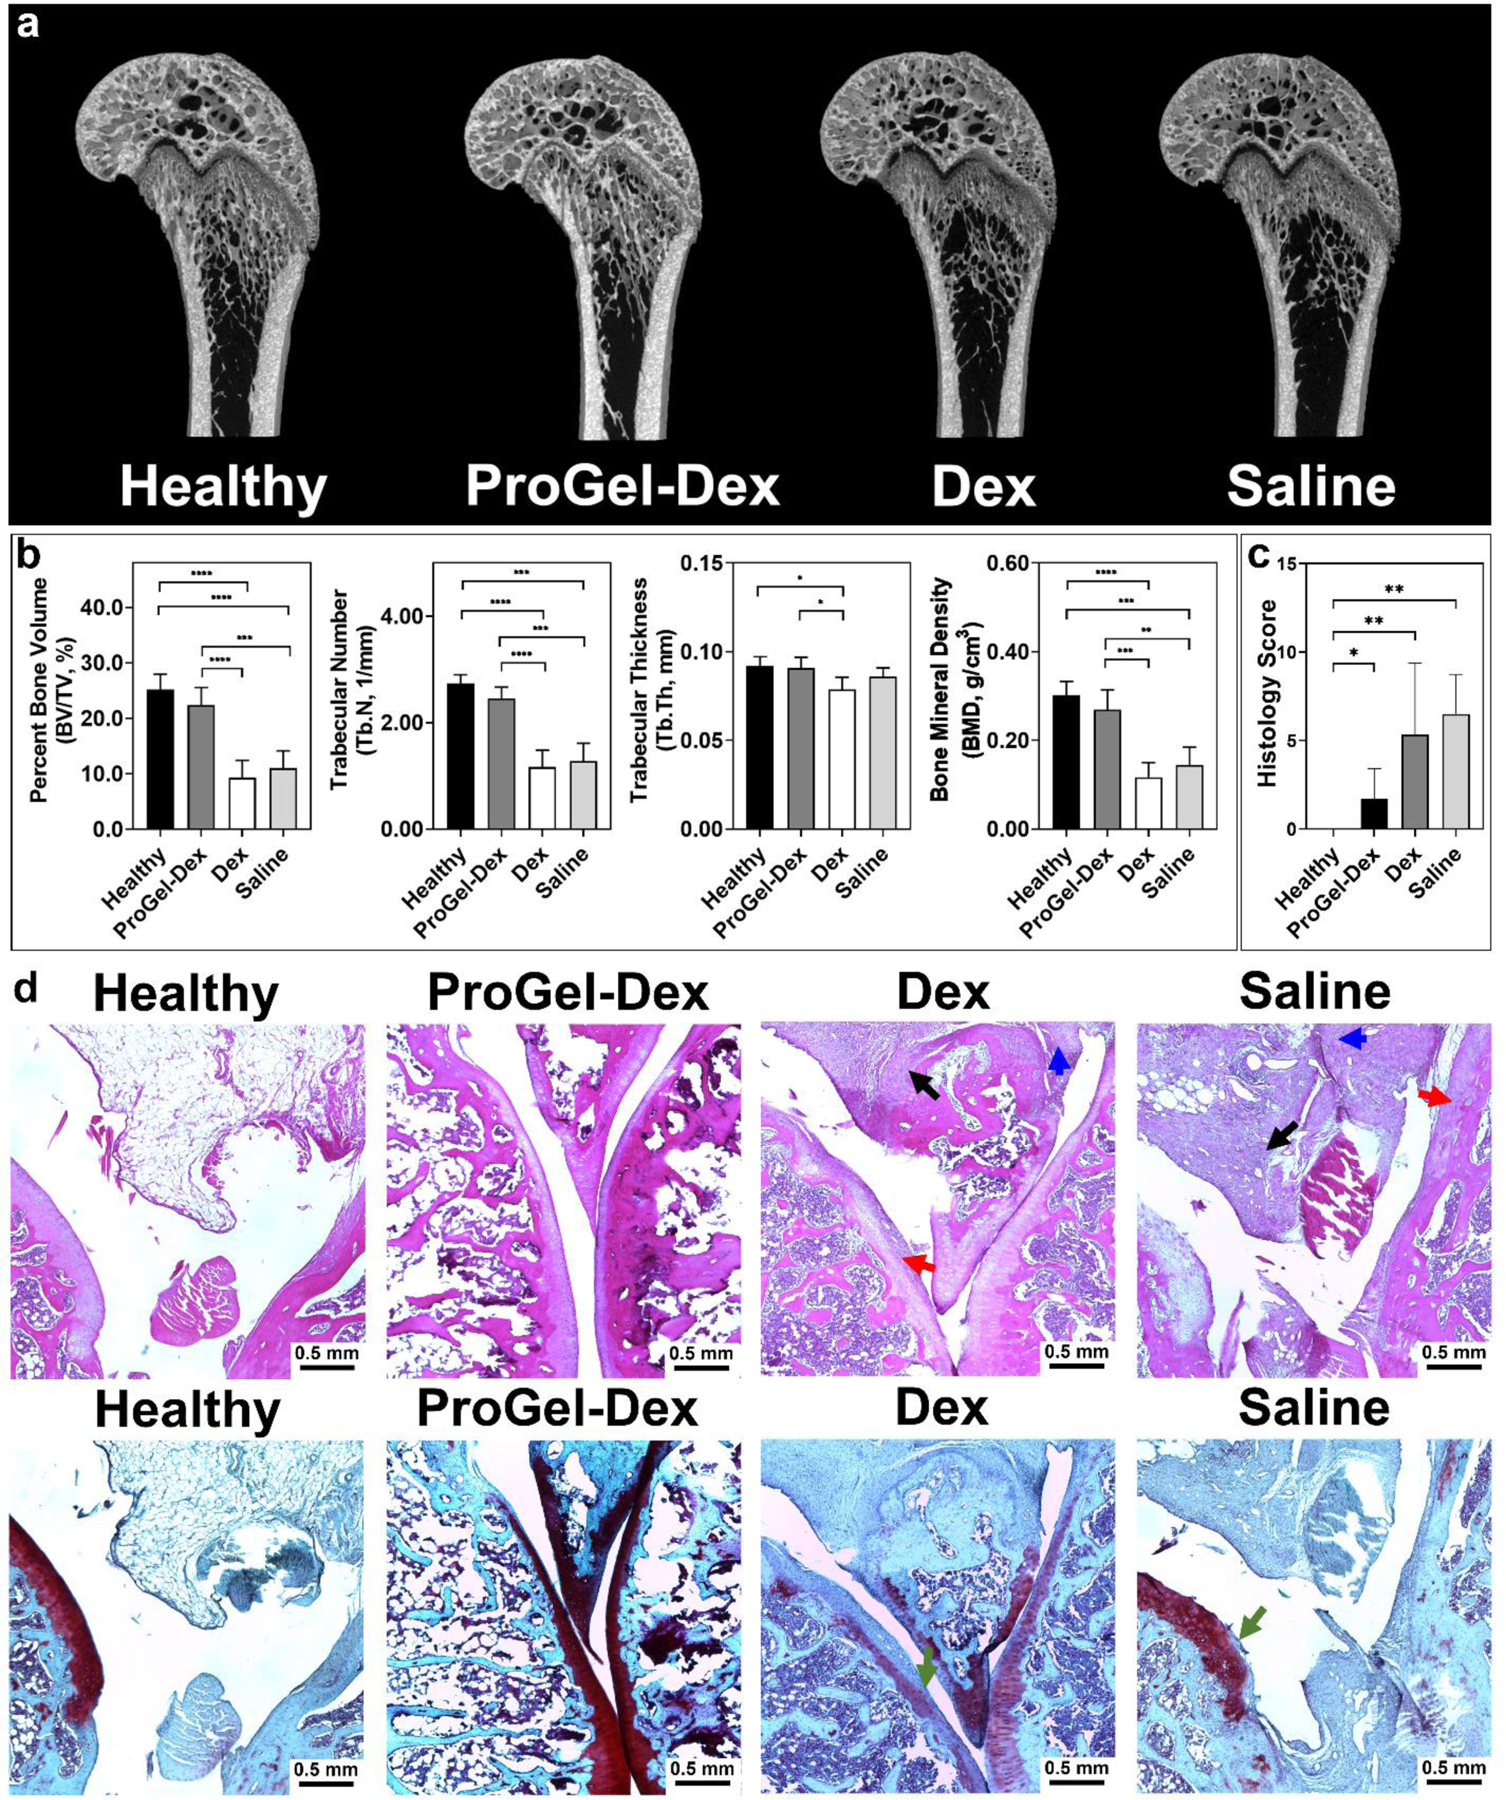
Figure 7.

Bone quality and histology evaluation of the ProGel-Dex treated MAA rats. (a) Representative reconstructed knee joint images of MAA rats, including the growth plate and associated resting, proliferative, and hypertrophic zones. (b) Micro-CT quantitative analysis of femoral trabecular bone quality of the MAA rats. (c) Sum of histology scores of H&E stained sections from MAA rats evaluated and scored by a professional pathologist, who was blinded to the group arrangement. (d) Histology of knee joints photographed at 400× magnification. Upper panel, H&E stained; lower panel, Safranin O stained. Cellular infiltration in periarticular soft tissue, bone, and cartilage destruction are clearly evident in the Dex and Saline groups. Black arrow: synovial cell lining hyperplasia; red arrow: pannus formation; blue arrow: mononuclear cell infiltration; green arrow: cellular infiltration in cartilage. *, P ≤ 0.05; **, P ≤ 0.01; ***, P ≤ 0.001; ****, P ≤ 0.0001.
