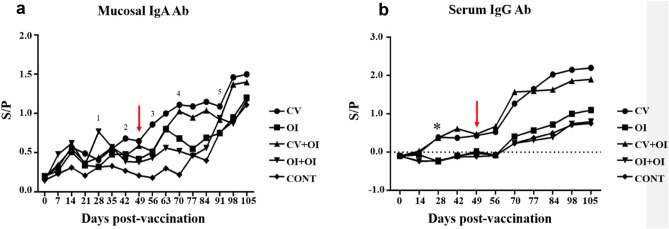
Figure 3.
(a) Mucosal IgA antibody response related to different immunization protocols (D0) against M. hyopneumoniae along the experimental period. Dots represent the mean values of each group in each day of sampling. Positive S/P values > 0.4. (b) Serum IgG antibody response obtained in different immunization protocols (D0) against M. hyopneumoniae along experimental period. Piglets challenged with M. hyopneumoniae on D49 (red arrows). Dots represent the mean values of each group in each day of sampling. Positive S/P values > 0.3. Kruskall-Wallis test was used.

