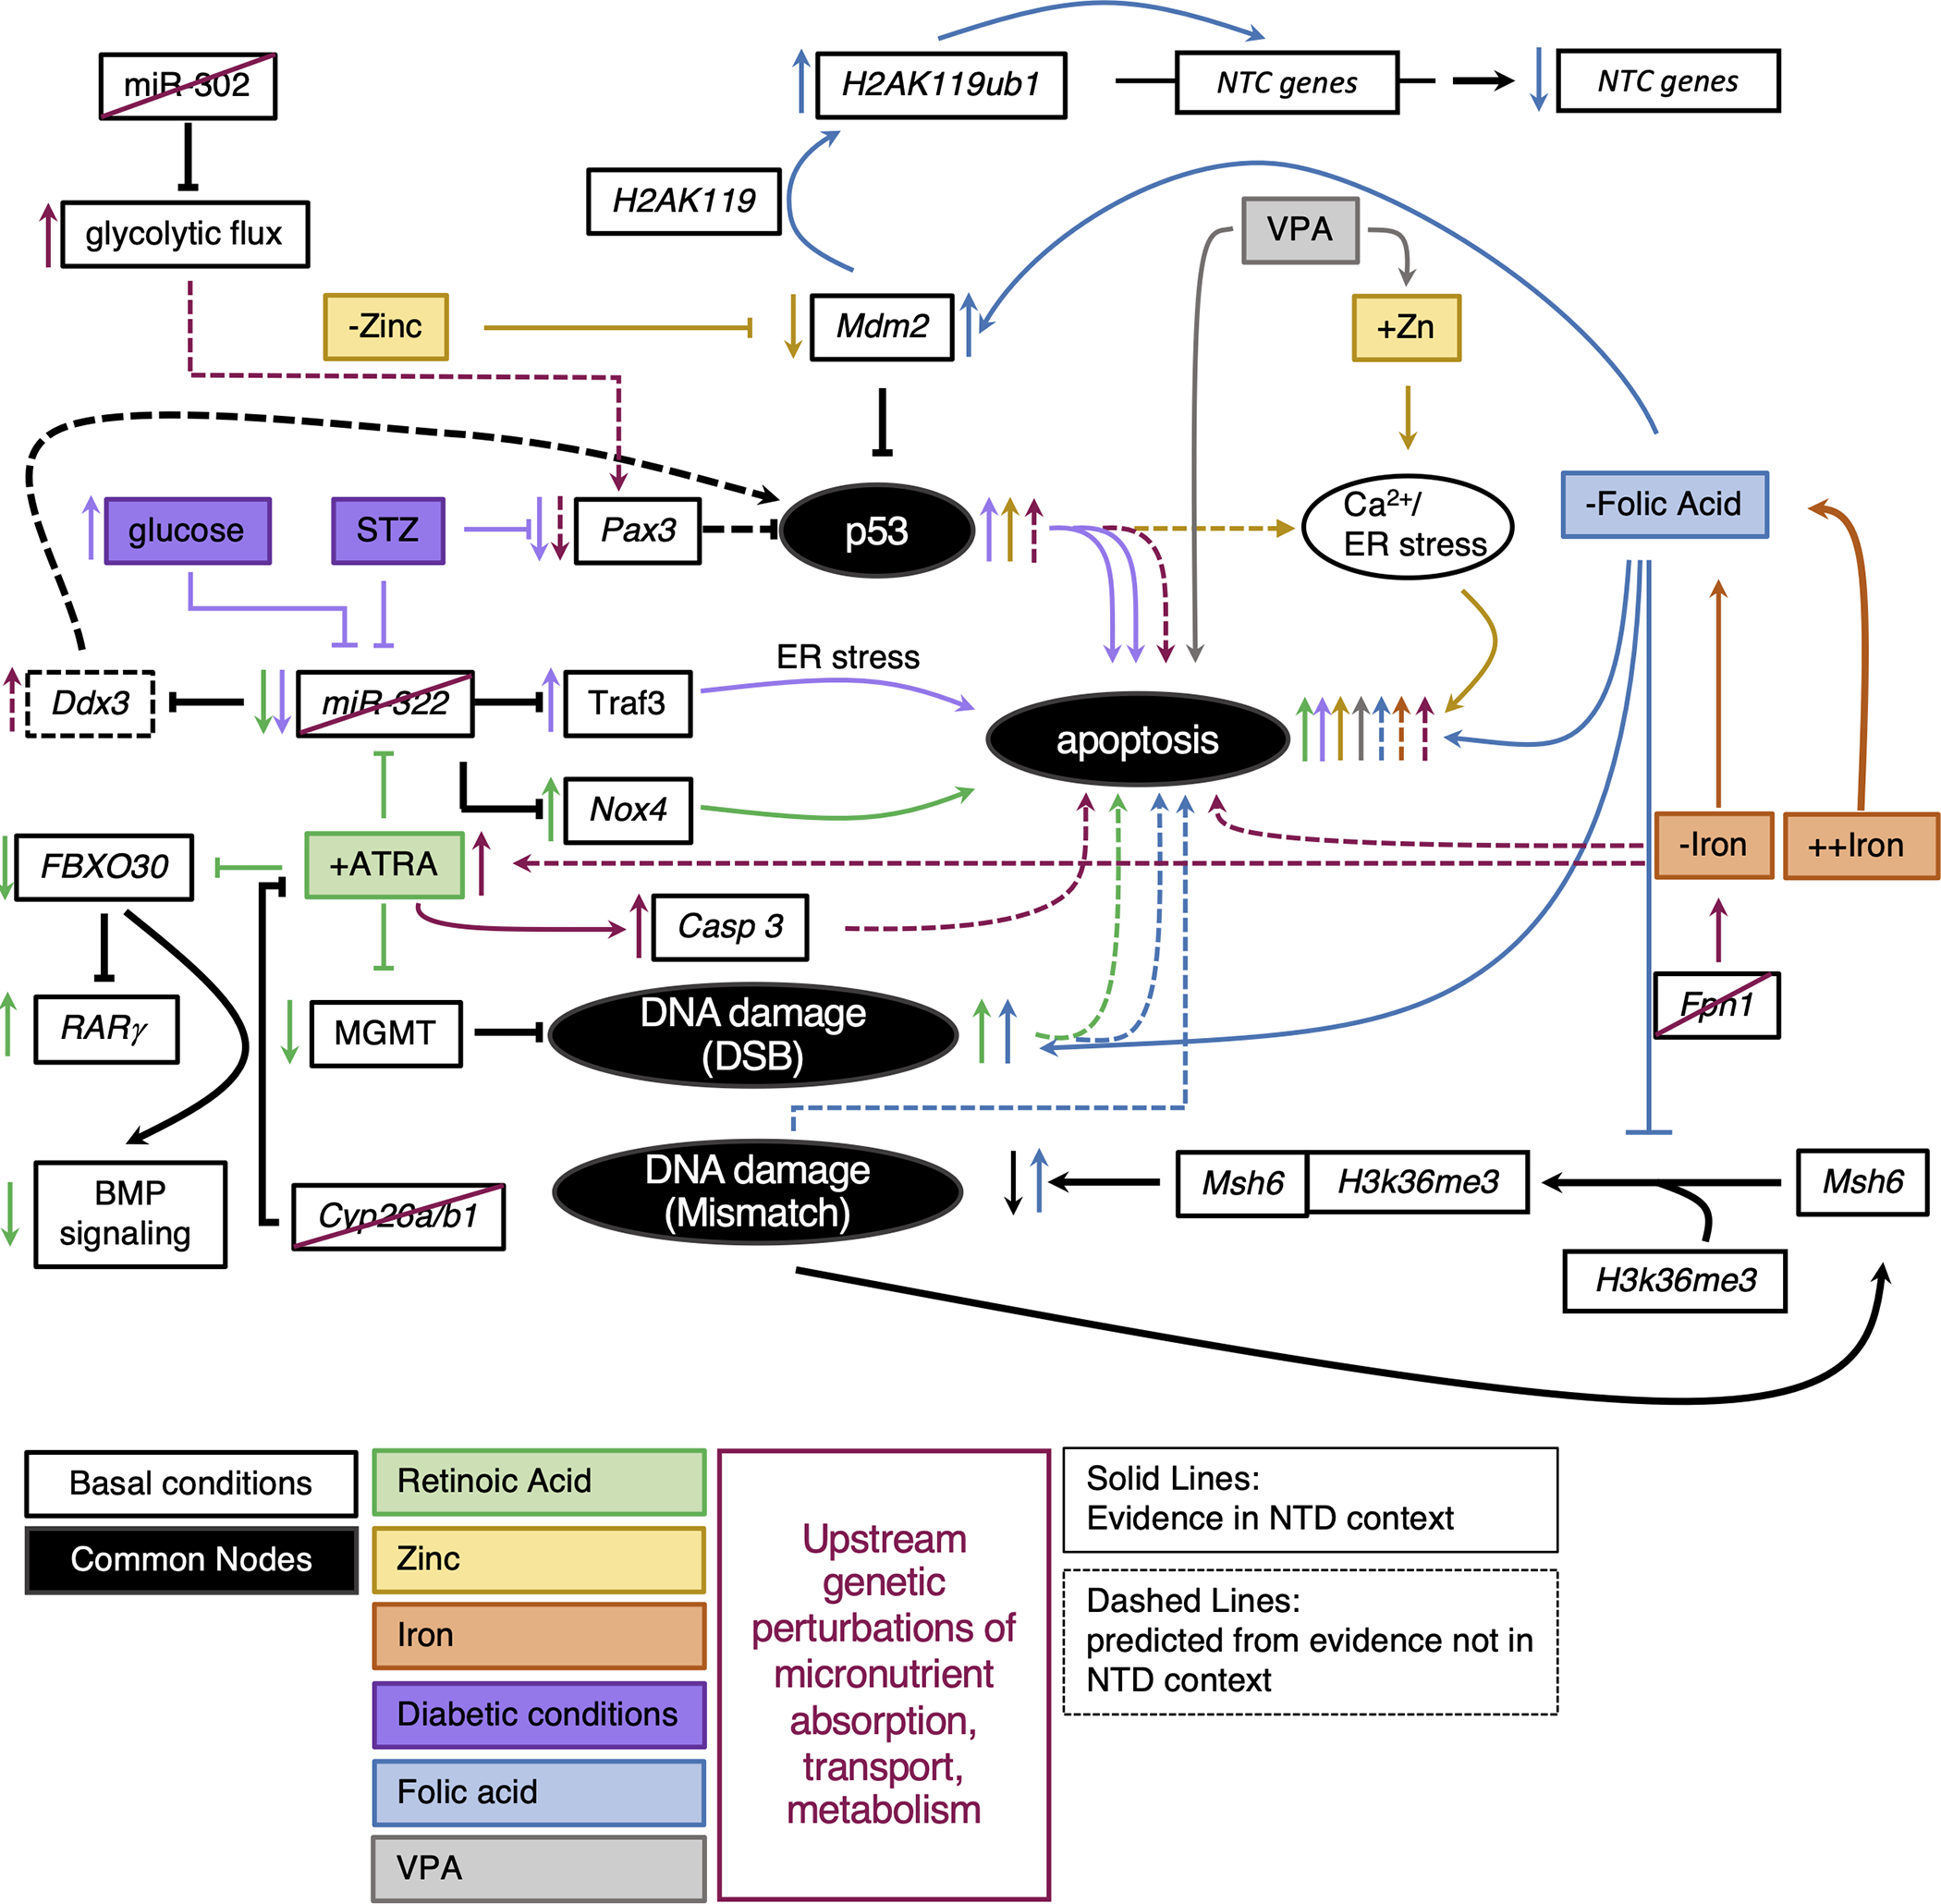
Figure 1.

Integrated model of convergent phenotypes across micronutrient imbalances. Black circles represent common nodes discussed. Basic pathways diagrams were drawn for mechanisms reviewed. The black lines indicate regulation under normal conditions. Colored lines correspond to action in micronutrient imbalance. Solid lines represent mechanism described in an NTD context. Dashed lines described mechanism described elsewhere that we predict could be involved in mechanism leading to NTD.
