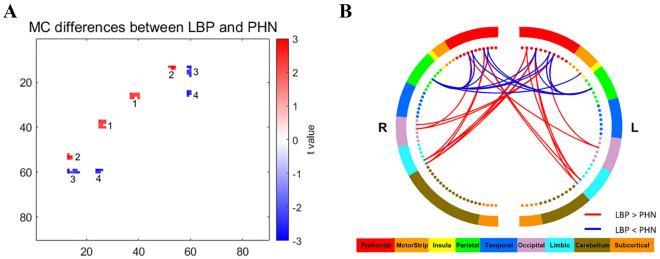
Figure 2.
Group differences in MC network between LBP and PHN. (A) Group differences in MC network between LBP and PHN. Increased MC in LBP patients were observed in red regions, i.e., cluster 1 and cluster 2 (p < 0.05). On the other hand, decreased MC in LBP patients were observed in blue regions, i.e., cluster 3 and cluster 4 (p < 0.05). Color bar represents t values. (B) Clusters with different MC in LBP compared with PHN. Red lines represent increased MC in LBP, while blue lines represent decreased MC in LBP. Color bar represents different brain regions.

