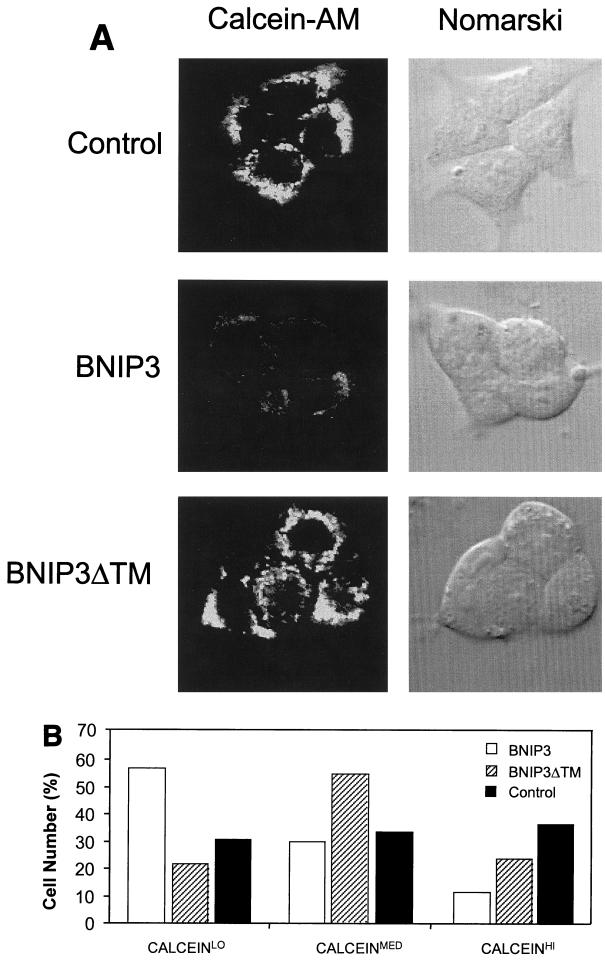
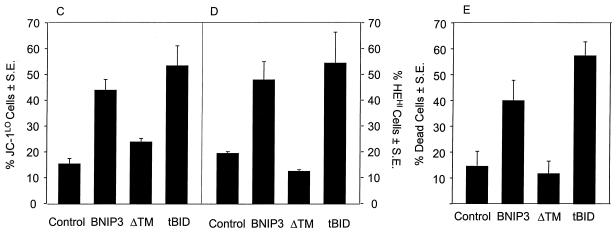
FIG. 9.
BNIP3-induced cell death is characterized by mitochondrial dysfunction. (A) Untransfected (control), BNIP3-T7 (BNIP3)- and BNIP3ΔTM-T7 (BNIP3ΔTM)-transfected 293T cells were harvested 24 h after transfection and incubated with calcein-AM in the presence of CoCl2 to quench cytoplasmic fluorescence. Cells were visualized by confocal laser microscopy (left) and Nomarski optics (right). (B) Quantitation of calcein fluorescence of cells transfected as described for panel A. The percentages of cells measured as low (CALCEINLO), intermediate (CALCEINMED), or high (CALCEINHI) total fluorescence units per cell are shown. The experiment was repeated with similar results. By chi analysis, P < 0.001 for the comparison of control versus BNIP3 and BNIP3ΔTM versus BNIP3. (C) Untransfected (control) and BNIP3-T7 (BNIP3)-, BNIP3ΔTM-T7 (ΔTM)-, or tBID-FLAG (tBID)-transfected 293T cells were harvested at 24 h, stained with JC-1, and analyzed by flow cytometry as a measure of Δψm. JC-1LO cells were defined as cells that were gated within the same range as those treated with 50 μM ClCCP (∼99%). BNIP3- and tBID- but not BNIP3ΔTM-transfected cells were significantly suppressed compared to controls (P < 0.01). (D) Cells treated as in panel C were stained with HE to measure ROS production. HEHI cells were defined as cells that were gated within the same range as those treated with 30% H2O2 for 15 min (∼98%). Levels in BNIP3- and tBID-expressing cells were significantly increased compared to untreated controls or BNIP3ΔTM (P < 0.03; the Student t test). (E) Samples from the control and each of the transfections in panel C were trypan blue stained as a measure of cell death. BNIP3- and tBID-transfected cells were significantly increased compared to untreated controls or BNIP3ΔTM (P < 0.01; the Student t test).


