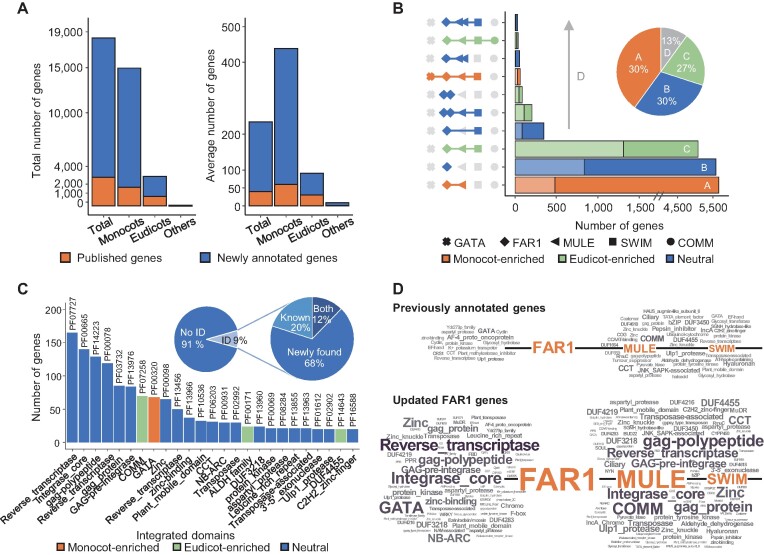
Figure 1.
Characteristics of the re-annotated FAR1 gene family in 80 plant species. (A) Total and average numbers of FAR1 genes identified from 80 plant species, including 35 monocots and 36 eudicots, are illustrated as bar plots. Orange and blue bars indicate previously published genes and newly annotated genes, respectively. (B) The numbers of top 10 gene architectures found in the FAR1 genes are shown in bar plots, while the overall ratio of the top three structures and the others are presented in the pie chart. Different shapes on the left represent individual domains, and bar colors indicate taxonomic enrichment test results for each gene structure (P < 0.0001). Bars with lighter colors show numbers of published genes, whereas darker colors show newly annotated genes. (C) The numbers of genes with different integrated domains (IDs) are depicted as bar plots (top 25), and the overall proportion of genes containing IDs is displayed as pie charts. The pie chart on the right shows the proportion of IDs found in previously or newly annotated genes or both. Bars were colored according to taxonomic enrichment test results (P < 0.0001). (D) ID repertoires are depicted for published genes only and all genes, including those newly annotated in the current study. The approximate number of each ID is proportional to its size, and the major domains are highlighted in orange.

