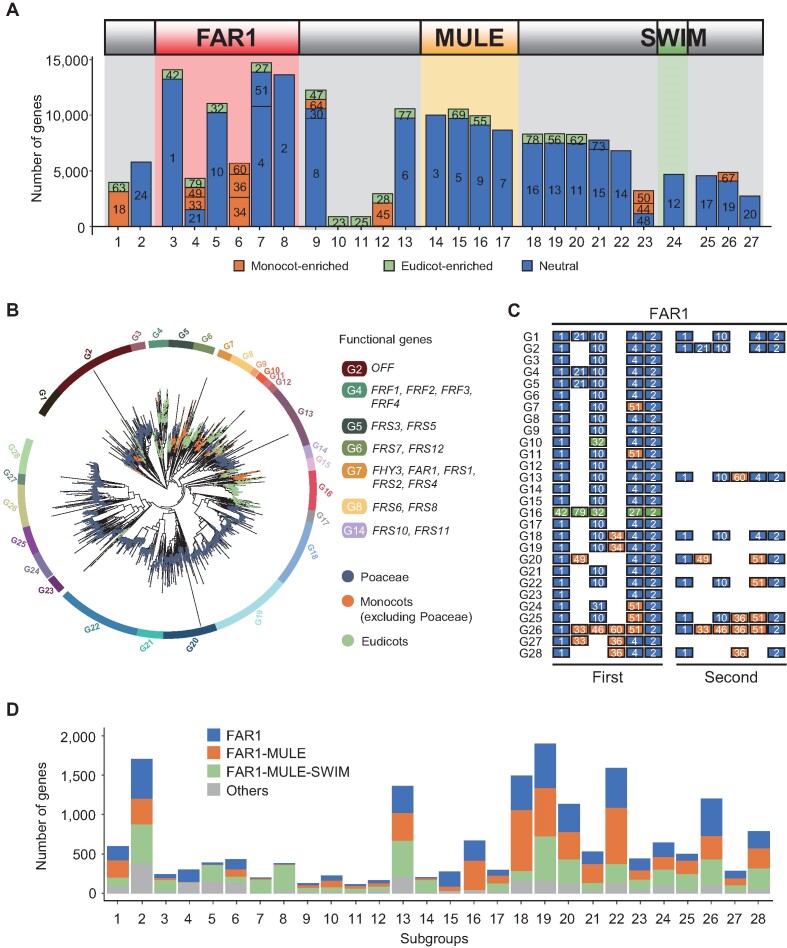
Figure 2.
Motif composition of the top three domain architectures, phylogenetic relationships, and subgroup characteristics of FAR1 genes. (A) The motif architectures of the top three gene architectures, consisting of FAR1, MULE and/or SWIM domains, are portrayed. The numbers in bars indicate motif labels described in Supplementary Table S5. (B) The inferred phylogenetic relationships of FAR1 genes among 80 plant species are depicted. Colored bars on the outer ring show distinct subgroup divisions and colored dots on the branch tips indicate taxonomic groups. Functional FAR1 genes in Oryza sativa ssp. japonica and Arabidopsis are highlighted in the legend. (C) First and second most abundant motif compositions of FAR1 domains are outlined for each subgroup. The top two structures are shown when the number of the second most common structure was above 50. (D) The numbers of top three gene structures and other structures are shown for each subgroup. For panels A, C and D, box colors indicate monocot-enriched, eudicot-enriched or neutral (P < 0.0001).

