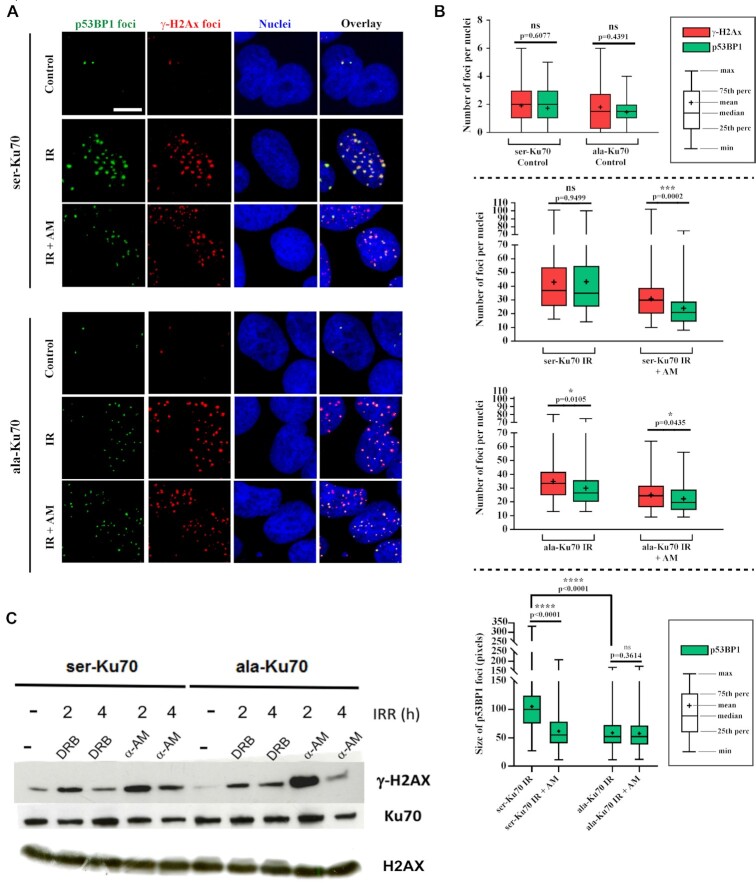
Figure 4.
Phospho-53BP1 foci formation is impaired following irradiation in cells expressing unphosphorylable ala-Ku70; inhibition of RNA Poll II impairs foci formation in cells expressing the phosphorylable ser-Ku70. (A) Immunofluorescence labelling of γ-H2AX and p-53BP1 (S1778) foci in cells expressing ser-Ku70 or ala-Ku70. Foci were assessed in the untreated control (Control) or at 1 h post-irradiation (2Gy) without (IR) or with α-amanitin pre-treatment (2 h prior irradiation at 50 μg ml–1). Scale bar (white) corresponds to 10 μm. (B) Each analysis was performed on at least 100 cells, and at least 10 images of each condition were analysed. Confocal microscopy optical slice sections of 8–20 μm were recorded from the apical to the basal pole of the cells, with each acquisition containing 26 stacks. Images were prepared and stacked with ImageJ software (Bethesda, MD) (48) by using the stacks tool. Then TIFF images were converted into 8 bits before performing γ-H2AX and p53BP1 foci counts. Cell Profiler software (Cambridge, MA) (49) was used for the detection and scoring of foci in p53BP1 and γ-H2AX images. The representation of data as a box plot was performed using GraphPad Prism 7. For statistical analysis, to compare the number of γ-H2AX and p53BP1 foci as well as the size of p53BP1 foci, in each condition, a Mann–Whitney rank test based on at least 100 observations was performed. (C) The specific inhibition of RNA Pol II by α-amanitin delays the level of γ-H2AX in ser-Ku70-expressing cells. Cells were untreated (–) or pre-treated with α-amanitin (AM) at 50 μg ml–1 or with 5,6-dichloro-1b-d-ribofuransylbenzimidazole (DRB) at 50 μM for 2 h and then irradiated at 4 Gy. Total protein extracts were done at 2 or 4 h post-irradiation of the cell culture. After SDS-PAGE, membranes were probed with anti-γ-H2AX (ser-139) antibodies. Anti-Ku70 (clone N3H10), and anti-H2AX were probed as controls.

