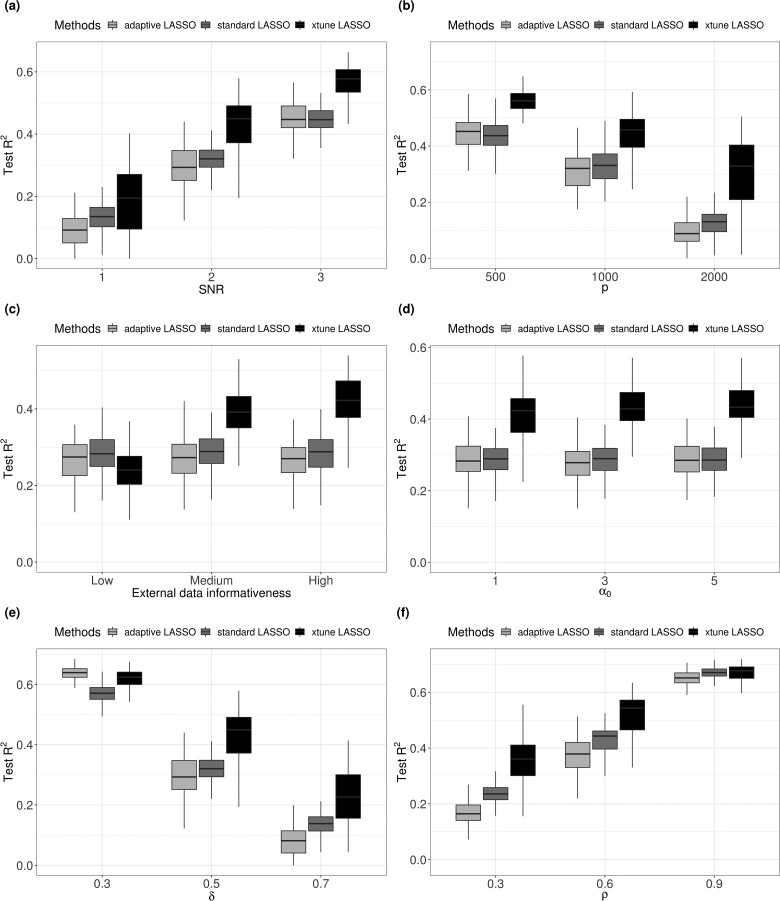
Fig. 1.
Simulation results. Subplot (a): SNR = 1, 2, 3, with n = 200, p = 1000, q = 10, . Subplot (b): p = 500, 1000, 3000, with n = 200, SNR = 2, q = 10, . Subplot (c): q = 10, 30, 50, with n = 200, p = 1000, SNR = 2, . Subplot (d): regression coefficients sparsity δ = , with n = 200, p = 1000, SNR = 2, q = 10, . Subplot (e): overall penalty magnitude α0 = 1, 3, 5, n = 200, p = 1000, SNR = 2, q = 10, . Subplot (f): , with n = 200, p = 1000, SNR = 2, q = 10,

