Figure 1 .

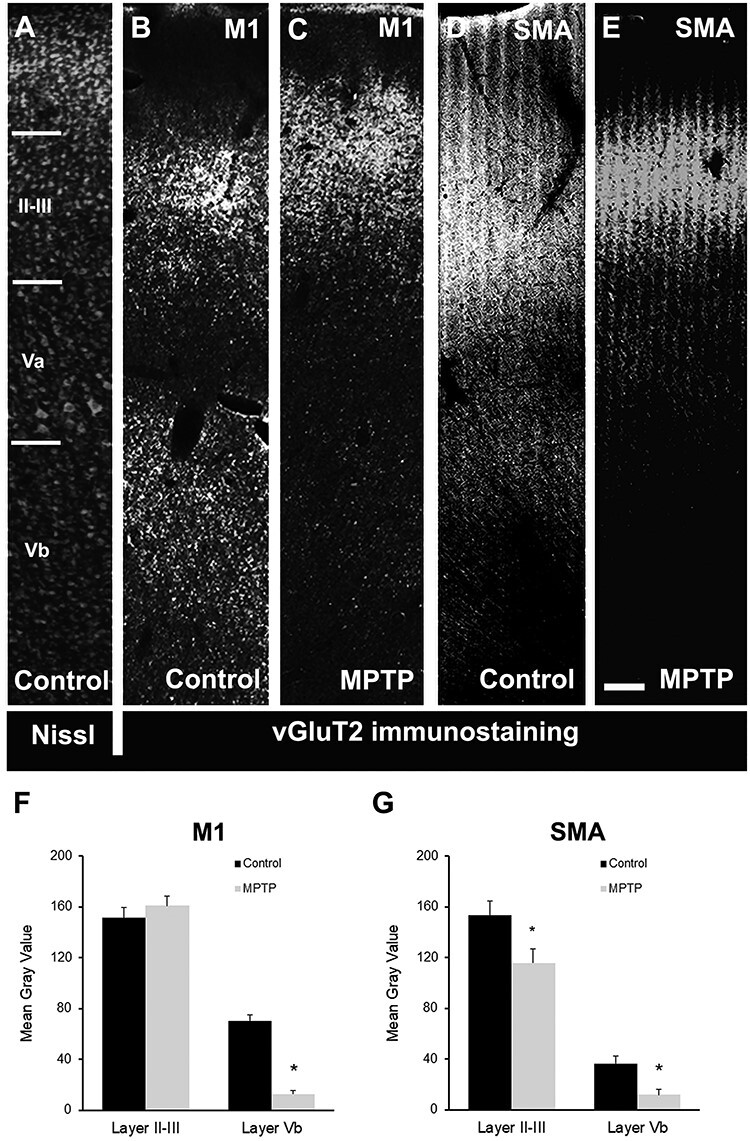
Light microscopy images of motor cortical areas. (A) Nissl-stained section (inverted to a darkfield image) showing the different cortical M1 layers. (B–E) Light microscopy (inverted images) of vGluT2 immunostaining in M1 (B and C) and SMA (D and E) cortex in control (B and D) and MPTP-treated (C and E) animals. (F and G) Comparison of vGluT2-immunostaining intensity (mean gray value) in M1 (F) and SMA (G) cortical layers II–III and Vb in control and MPTP-treated parkinsonian monkeys. There is a significant decrease in the intensity of vGluT2 immunoreactivity in layer Vb of M1 (80–85%; Student’s t-test, *P ≤ 0.001) and SMA (~70%; Student’s t-test, *P = 0.037) in parkinsonian animals. In SMA (G), there is also a significant decrease in labeling in layers II–III in MPTP-treated monkeys (~25%; Student’s t-test, *P = 0.007). Scale bar in E (applies to A–D): 250 μm.
