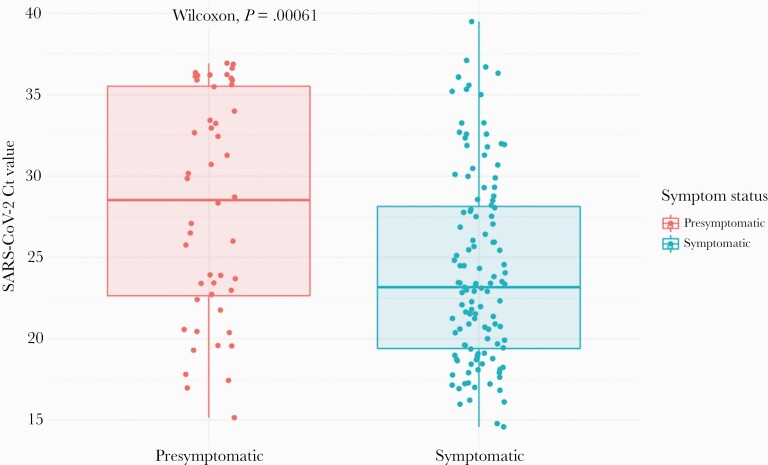
Figure 2.
Comparison of viral loads in symptomatic (n = 124) vs presymptomatic (n = 48) positive and inconclusive samples. Cycle thresholds for samples (each represented by 1 dot) tested using our protocol with nucleic acid extraction (before November 18) are shown here. Complete data are shown in Supplementary Figure 6. Box plots show the median values and 25th and 75th percentiles, with vertical lines demonstrating the range of values. Abbreviations: Ct, cycle threshold; SARS-CoV-2, severe acute respiratory syndrome coronavirus 2.

